
jansucko/iStock via Getty Images
Introduction
The Canadian company Wheaton Precious Metals (WPM) released its fourth-quarter and full-year 2021 results on February 7, 2022. Wheaton will release its 2021 fourth quarter and full-year results on Thursday, March 10, 2022, after market close.
1 – A quick snapshot of the 4Q21 and full-year results
The company produced 750,220 GEOs in 2021 within production guidance as shown below:
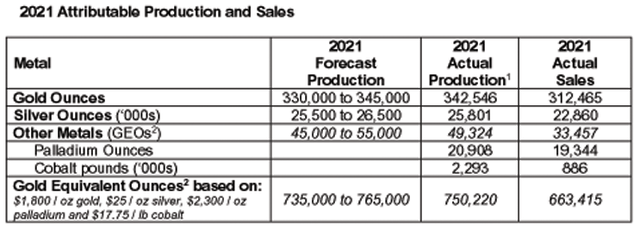
WPM: Table production 4Q and full-year 2021 (Wheaton Precious Metals)
In 2021, gold equivalent ounce production, GEO, exceeded the midpoint of guidance primarily due to stronger-than-expected production from Peñasquito, Antamina, Constancia, and Voisey’s Bay, partially offset by weaker production from Salobo and Sudbury.
In 2021, GEO production was up 9.9% compared to 2020 (682,630 GEOs).
The company also indicated its 2022 guidance and gave a 5-year and 10-year production average:
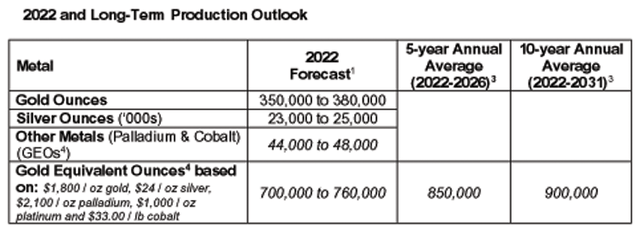
WPM: 2022 Guidance press release (Wheaton Precious Metals)
The production for 2022 is expected to be slightly lower than what was produced in 2021. The forecast for 2022-2026 is expected to be 850K GEOs, and for 2022-2031, it is expected to be 900K GEOs. Both estimates are well above 2021 production.
Randy Smallwood, Wheaton’s President, and Chief Executive Officer said in the press release:
Wheaton further diversified its asset base in 2021 by adding five additional streams of development assets, which will contribute to our steady organic growth over the next five years. Given the strong tenure of our reserve and resource base, we are also pleased to present ten-year production guidance showing continued strength in our portfolio.
2 – Stock performance
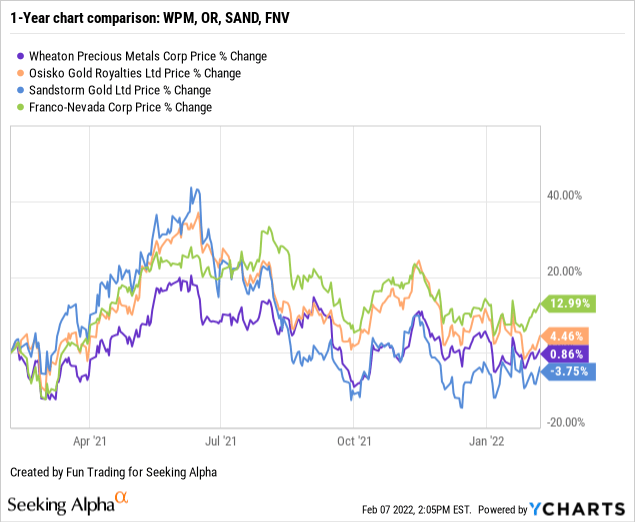
Wheaton Precious Metals is part of my core long-term streamer with Franco-Nevada (FNV). Below is the one-year performance.
WPM is up 1% on a one-year basis, underperforming its rival Franco-Nevada.
3 – Investment Thesis
The investment thesis remains the same for Wheaton Precious Metals and Franco-Nevada. Those two companies are the “streamer of choice” and should be kept as a long-term investment.
I have held a core long-term position in WPM and FNV for many years, and I have been satisfied, even if I was a little disappointed by Wheaton Precious Metals’ performance lately.
However, trading short-term LIFO volatility is crucial, and I recommend allocating about 30%-40% of your position to take advantage of the short-term fluctuations.
This dual strategy is even more vital now with the risk of inflation that could force the Fed to act more aggressively and hurt gold in the process.
So far, the gold price is responding quite well because investors believe that the Fed will not raise interest above the 25-point.
2022 will be a very volatile year. However, while it is a positive move for gold short-term, it could turn quickly negative later this year if the Fed realizes that it needs a more aggressive policy to get inflation under control. In short:
Wheaton Precious Metals: Financials And Production In 4Q21
| Wheaton Precious | 4Q20 | 1Q21 | 2Q21 | 3Q21 | 4Q21 |
| Total Revenues in $ Million | 286.21 | 324.12 | 330.39 | 268.96 | – |
| Net Income in $ Million | 157.22 | 162.00 | 166.12 | 134.94 | – |
| EBITDA $ Million | 213.58 | 232.41 | 237.37 | 190.85 | – |
| EPS diluted in $/share | 0.35 | 0.36 | 0.37 | 0.30 | – |
| Cash from operating activities in $ Million | 207.96 | 232.15 | 216.42 | 201.28 | – |
| Capital Expenditure in $ Million |
0.28 |
155.33 |
64.78 |
1.81 |
– |
| Free Cash Flow in $ Million |
207.68 |
76.82 |
151.63 |
199.48 |
– |
| Total cash $ Million | 192.68 | 191.16 | 235.45 | 372.45 | – |
| Long-term debt in $ Million | 195.0 | 0.0 | 0.0 | 0.0 | – |
| Dividend per share in $ | 0.13 | 0.13 | 0.15 | 0.15 | – |
| Shares outstanding (diluted) in Million | 450.6 | 450.6 | 451.2 | 451.7 | – |
| Production details | 4Q20 | 1Q21 | 2Q21 | 3Q21 | 4Q21 |
| Production in Gold Equivalent K Oz GEO | 178.8 | 190.4 | 194.1 | 184.9 | 180.8* |
| Production in Silver Equivalent Oz SEO | 14,900 | 13,706 | 13,978 | 13,314 | – |
| Gold price realized $/Eq. Oz GEO | 1,882 | 1,848 | 1,870 | 1,764 | 1,798* |
| Silver price realized $/Eq. Oz SEO | 24.72 | 25.66 | 25.97 | 24.51 | 23.51* |
| The gold/silver ratio | 76.1 | 72.0 | 67.5 | 72.0 | – |
Source: Company release
* Estimated by Fun Trading.
Note: Historical data (more than four years) are only available for subscribers.
The gold price is estimated at $1,798 per GEO, while the silver price is estimated at $23.51 per SEO, as we can see in the graph below:
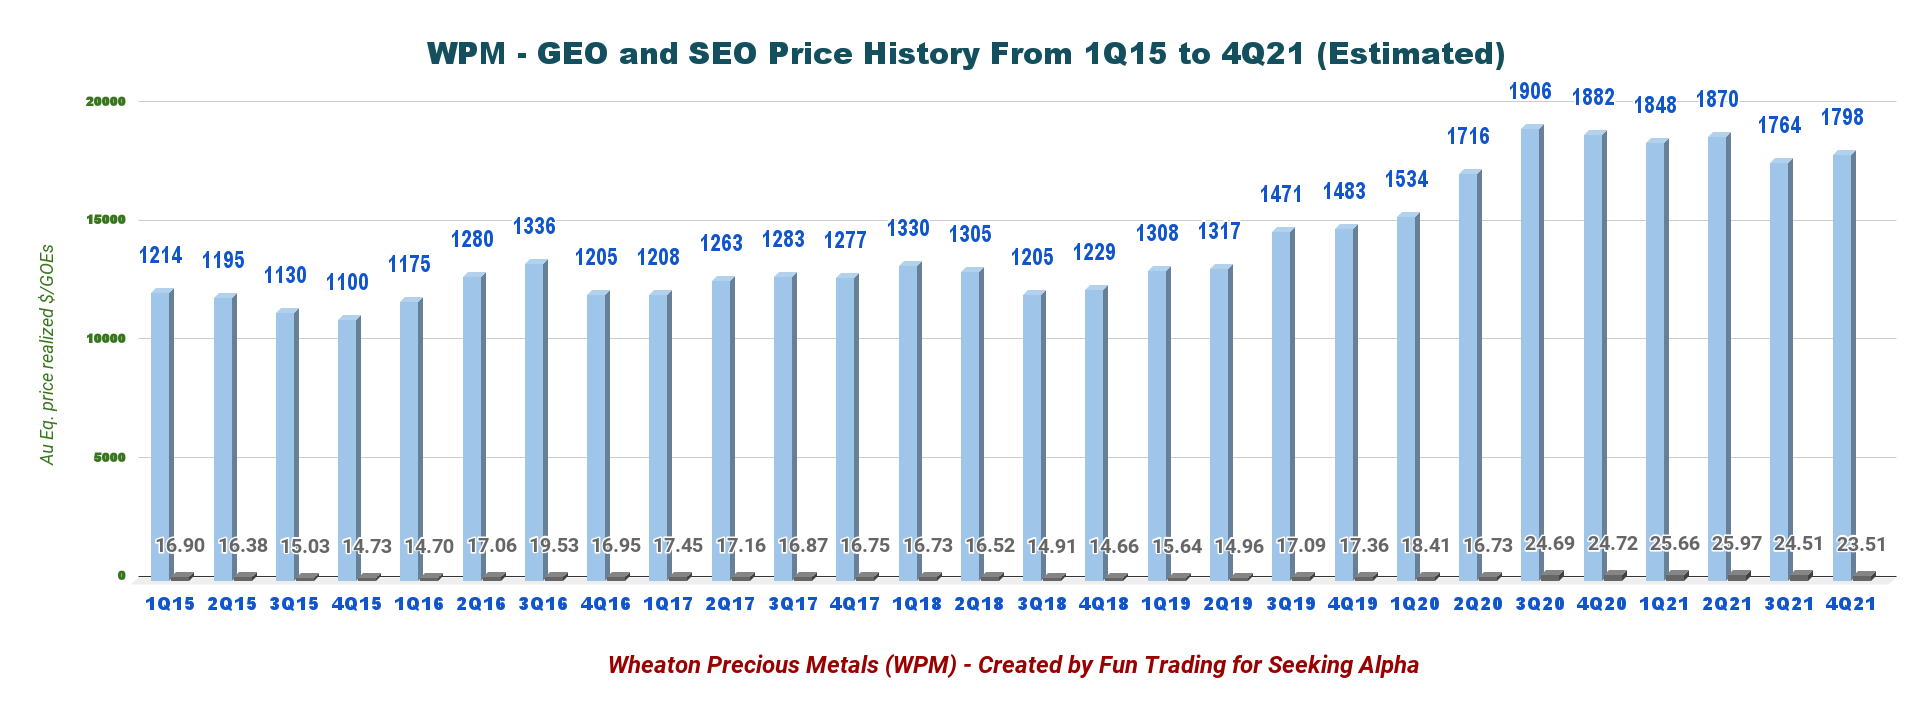
Chart price of gold and silver history (Fun Trading)
1 – Production in gold equivalent ounce and trend details
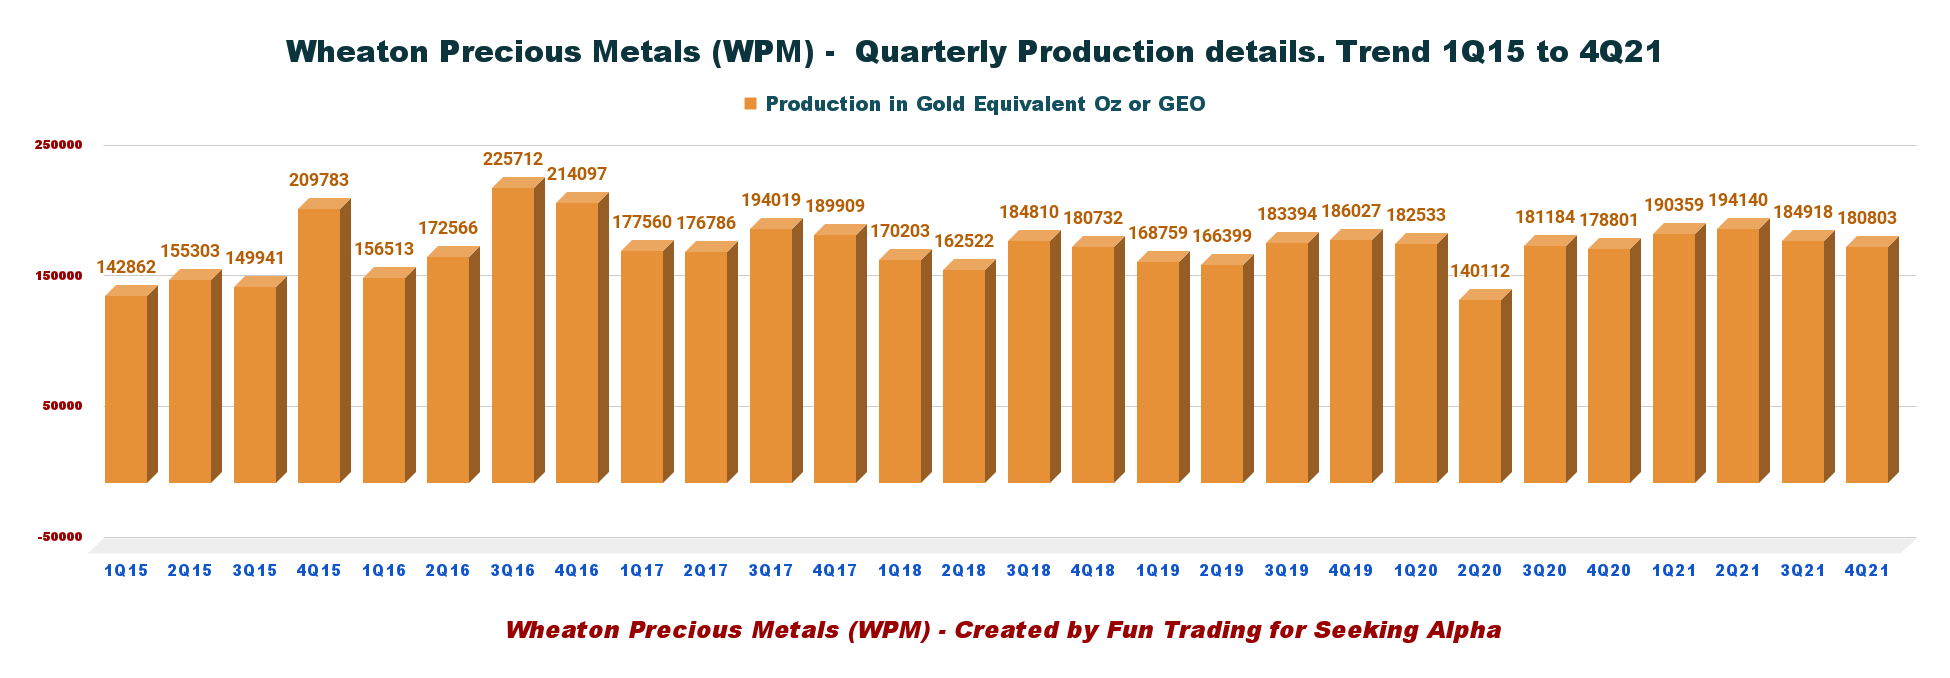
Chart GEO production history (Fun Trading)
This quarter’s attributable gold equivalent production was 180,803 GEOs compared to 178,801 GEOs in the prior-year quarter.
Wheaton’s metals production was:
- Gold: 342,546 Oz
- Silver: 25,801K Oz (~358,350 GEOs)
- Other Metals: 49,324 GEOs
Other metals are comprised of Palladium with 20,908 oz and Cobalt with 2,293K Lbs.
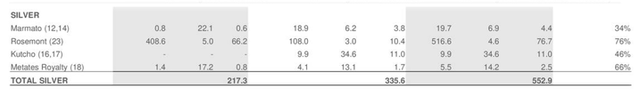
2 – 2020 Reserves (Total Proven and Probable)
Total Reserves P3 are 11.21 Moz of gold, 552.9 Moz of silver, 0.64 Moz of palladium, and 31.7 Moz of Cobalt.
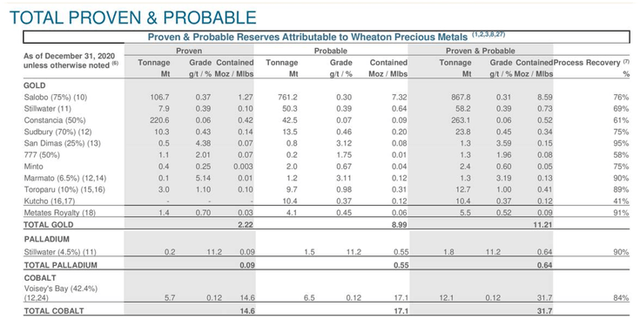
WPM: Table reserve 1 (WPM Presentation)
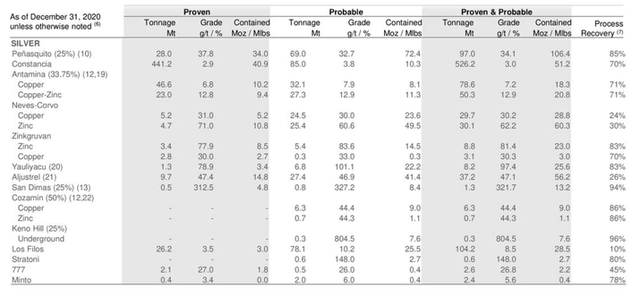
WPM Reserves table 2 (WPM Presentation)
WPM Reserve 3 (WPM Presentation)
Technical Analysis (short-term) and Commentary
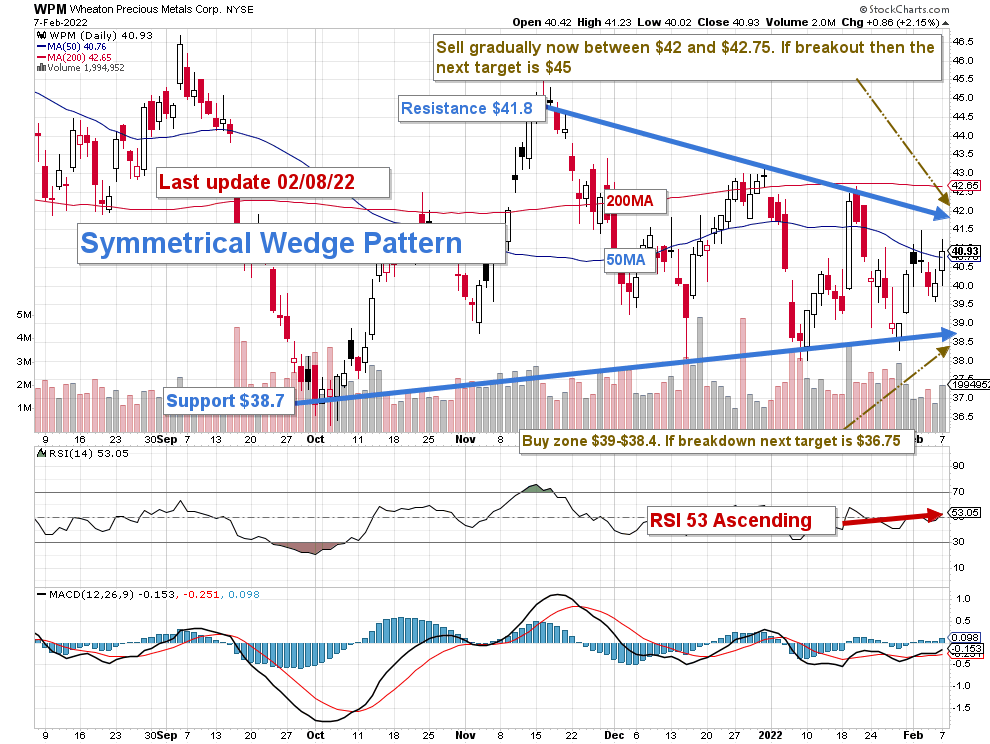
TA Chart WPM (Fun Trading )
Note: The chart is adjusted for the dividend.
WPM forms a symmetrical wedge pattern with resistance at $41.8 and support at $38.7. The trading strategy is to sell about 30% of your position between $42 and $42.75.
I believe it is safe to accumulate WPM below $39.3. However, if the stock breaks down, the next lower support is $37.75.
I recommend keeping a core long-term position and using about 30% to trade LIFO while waiting for a higher final price target for your core position.
As I have explained in my introduction, the gold price will experience wild swings in 2022, and the best answer is to adopt a trading strategy while keeping a core position for the next level.
Warning: The TA chart must be updated frequently to be relevant. It is what I am doing in my stock tracker. The chart above has a possible validity of about a week. Remember, the TA chart is a tool only to help you adopt the right strategy. It is not a way to foresee the future. No one and nothing can.
Author’s note: If you find value in this article and would like to encourage such continued efforts, please click the “Like” button below as a vote of support. Thanks!