
DarrelCamden-Smith/iStock via Getty Images
The Q4 and FY2021 Earnings Season for the Gold Miners Index (GDX) has finally begun and one of the most recent companies to report its results is Royal Gold (RGLD). During the most recent quarter and six-month period, the company beat its gold-equivalent ounce [GEO] volume guidance, grew revenue by nearly 13%, and reported H2 earnings per share of $2.11. This was despite deferred silver deliveries at Pueblo Viejo and helped by new contributions from Khoemacau and NX Gold. Given Royal Gold’s impressive track record of dividend and earnings growth, I would view any pullbacks below $107.50 as buying opportunities.

Andacollo Mine (Teck) – 100% Gold Stream held by Royal Gold (Company Presentation, Teck Resources)
Royal Gold released its December quarter and six-month results last week, reporting a production volume of ~191,300 GEOs, above its upward revised guidance midpoint of ~185,000 GEOs. This growth was helped by new contributions from the NX Gold Mine in Brazil and Khoemacau in Botswana and higher gold sales from Mount Milligan. Notably, this was despite deferred silver deliveries from the massive Pueblo Viejo Mine. Meanwhile, the Red Chris royalty has yet to kick in but will boost Q1 revenue after the recent $165 million acquisition of a 1.0% net smelter return [NSR] royalty on the massive British Columbia copper-gold mine.
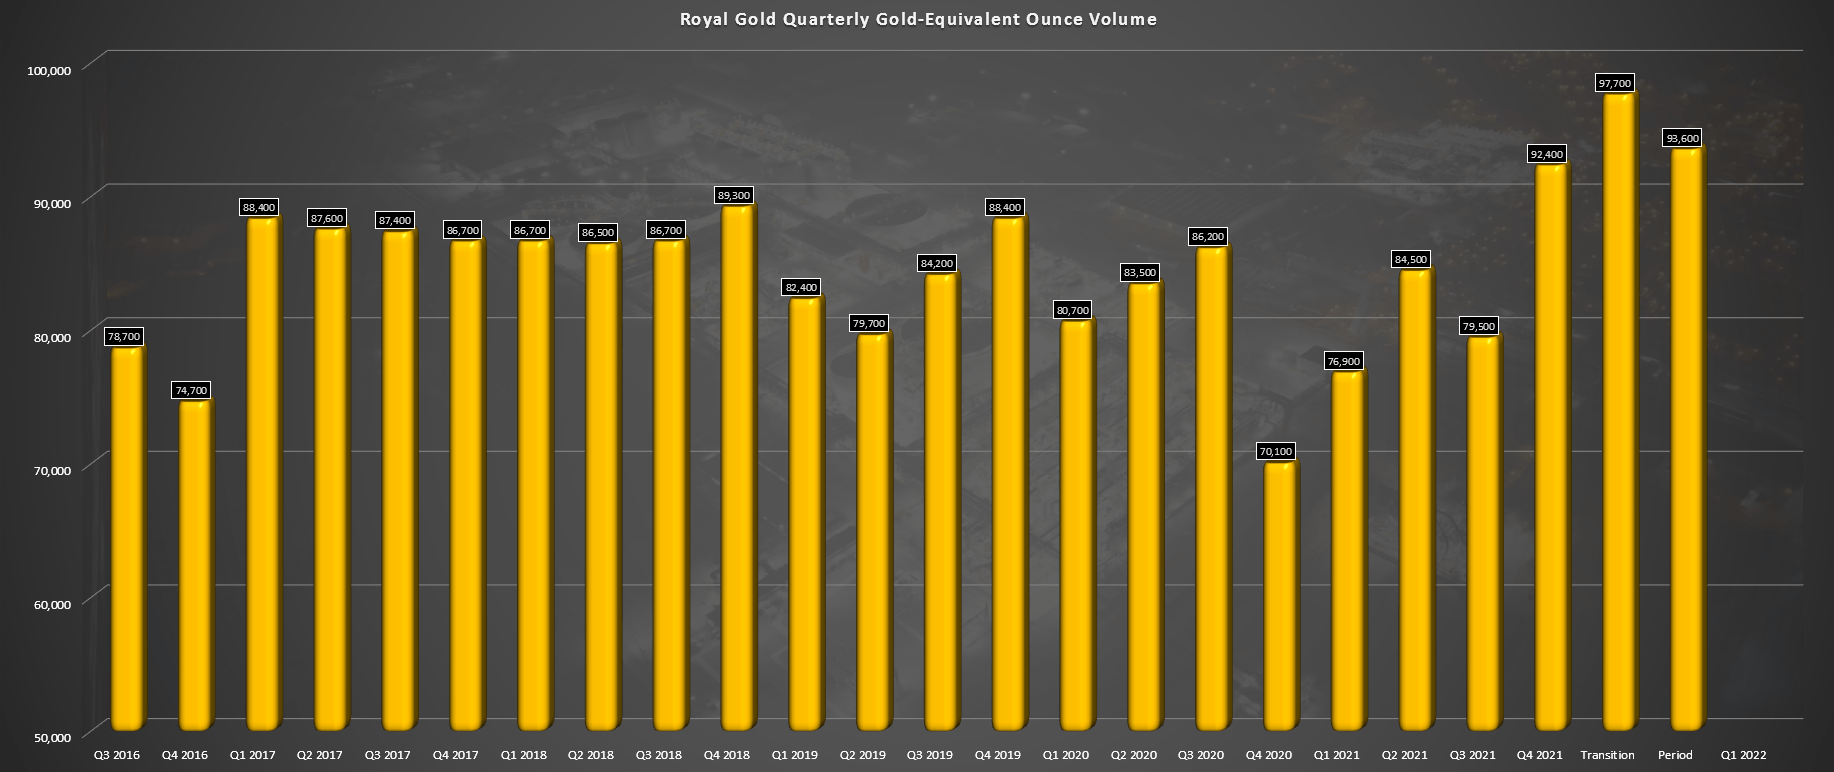
Royal Gold Quarterly GEO Volume (Company Filings, Author’s Chart)
If we look at Royal Gold’s GEO volume above, we can see that we’re finally seeing a transition to growth, but we’re still in the very early innings of this growth for Khoemacau. This is because Royal Gold recently increased its stream to 100% on the Khoemacau Copper Mine in Botswana, which could translate to annual deliveries of up to 2 million ounces of silver, translating to annual revenue of nearly $40 million based on current silver prices. In the most recent quarter, revenue from Khoemacau increased substantially with mining underway but came in just shy of $5 million, with this figure set to double by mid next year.

Royal Gold – Quarterly Revenue by Mine (Company Filings, Author’s Chart)
Given the increased GEO volumes in the six-month period (~191,300 GEOs), Royal Gold reported revenue of $343 million, up from ~$305 million in the year-ago period. This translated to nearly 13% revenue growth despite lower gold prices ($1,792/oz vs. $1,892/oz) which was a headwind in the period. The sharp increase in revenue helped the company grow annual EPS by 14% year-over-year on a quarterly basis and to a new 6-month record of $2.11 per share, translating to more than 20% growth year-over-year.
Metals Prices
At the same time, as Royal Gold is seeing steady growth in GEO volumes with a busy past nine months (Red Chris, NX Gold, Khoemacau ramping up), metals prices appear to be firming up, which could provide a tailwind for earnings growth. Looking at the chart of gold below, we can see that the metal has spent nearly 18 months in a shallow but volatile correction from its Q3 2020 highs above $2,000/oz. This has set up a potential launchpad for a re-test of the $2,000/oz level sometime in the next 12 months, with sentiment supportive of higher prices, given that most market participants gave up on the gold in Q3 and Q4 2021.

Gold Futures Price (TC2000.com)

Gold – Bullish Sentiment (Gold DSI Data, Author’s Chart, Trade-Futures.Com)
Meanwhile, if we look at copper, the metal has also spent nearly nine months digesting its gains, and it looks like we could see a re-test of prior highs at some point this year as well. Notably, copper’s 200-day moving average remains in a strong uptrend and has increased from $2.50/lb to $4.30/lb, and in bull markets, corrections 10% below this level tend to find strong support. While a correction is possible in copper to shake out some weak hands, I would not be surprised to see a floor for copper near $3.95/lb to $4.00/lb, which would benefit Royal Gold given that more than 10% of its revenue comes from copper.
Based on the daily charts for gold and copper looking constructive, Royal Gold should see an extra boost to revenue this year. This is especially true on the gold side, given that the tough year-over-year comps (2021 vs. 2020) have now turned into much easier year-over-year comps due to gold’s consolidation last year. Hence, the current FY2022 revenue and earnings estimates for RGLD might end up being on the conservative side, and this would pick up any slack from the lower deliveries than expected from Khoemacau this year.

Copper Futures Price (StockCharts.com)
Khoemacau
As noted in previous updates, Khoemacau is a major growth pillar for Royal Gold, and the company is finally seeing the fruits of its investment this year. However, we did get a negative update from the asset in the quarter, which partially overshadowed the otherwise solid results. This was the fact that Khoemacau Copper Mining [KCM] has continued its ramp-up, but progress has been slow due to COVID-19-related headwinds, with Botswana hit hard by the Omicron variant. This has led to the full production timeline for the Khoemacau Mine being pushed out to Q4 2022 vs. Q3 2022 previously.

Botswana COVID-19 Cases (Worldometers.Info)
Fortunately, we have seen a dip in cases since the mid-January peak, and cases appear to be trending in the right direction. Still, this will lead to a lower revenue contribution than expected in FY2022 from Khoemacau, with the ramp-up to the 10,000-tonne per day target behind schedule. As of the most recent update, only 2% of the mining workforce is self-isolating, an improvement from 40% of the highest skilled operators unavailable to work in December. I do not see this delay as an issue for Royal Gold and merely a short-term hiccup.
The reason is that the revenue is simply deferred but has not gone anywhere, and the stream rate has actually increased (90% —> 100%). So, investors will have to wait another quarter or two longer to see meaningful deliveries from this asset (~2 million ounces per annum at 20% of the spot silver price). Obviously, this is a little disappointing, but investors should be comforted that it’s a timing issue due to COVID-19, not a metallurgical issue, a grade reconciliation issue, or a permitting issue, which would have medium to long-term ramifications.
Historical Dividend & Earnings Growth
Precious metals stocks are not known for being ‘growth’ stocks, and this is because earnings can be quite cyclical. However, most of the larger precious metal & royalty streaming companies are exceptions, with RGLD being a clear example. This is evidenced by very steady growth in cash flow and earnings per share over the past two decades, with a ~15% compound annual growth rate in cash flow per share (FY2002 to FY2022 estimates). Notably, the earnings growth was achieved despite weathering a secular bear market in gold (2012-2015), a mild cyclical bear market in gold (Q3 2020 – Q1 2022), and the Great Financial Crisis, which briefly derailed gold (2008).

Royal Gold Cash Flow Per Share & Dividend Growth (FASTGraphs.com)
For investors that like earnings per share growth that’s coupled with shareholder returns, the growth in the dividend has been just as impressive, with a ~16.3% compound annual dividend growth rate (FY2002 to FY2021). This beats out Dividend Aristocrats like PepsiCo (PEP) at ~11%, Kimberly-Clark (KMB) at ~8%, Target (TGT) at ~14%, and even AbbVie (ABBV) at ~14.6%. So, while Royal Gold’s dividend may be on the low end at ~1.20%, which keeps it under the radar of most income investors, the company’s dividend growth stands head and shoulders above most Dividend Aristocrats. In fact, this mix of earnings growth and dividend growth is hard to find in any sector, especially coupled with RGLD’s exceptional margins.
While Royal Gold’s cash flow per share growth came in slightly below estimates in FY2021 due to limited growth in gold-equivalent ounce volumes, we should see meaningful growth in FY2022 and FY2023, with the potential for cash flow per share of $8.00+ in FY2023 (FY2021: $6.20). This will be driven by a full year of contribution from Khoemacau at higher mining rates and a much higher silver stream rate than initially expected (100% vs. 80%). The other area of growth for Royal Gold is from the high-grade NX Gold Mine in Brazil, which should see 20% plus production growth medium-term. Finally, the KOTH Mine in Australia and the Bellevue Gold Mine are both set to begin production in the next 18 months.
For investors interested in Royal Gold’s long-term organic growth profile, my most recent article goes into more detail: Royal Gold: A Year Of Growth Ahead.
Valuation & Technical Picture
While Royal Gold has rallied sharply from its lows, the stock has made this move from a depressed valuation level, trading at levels that have coincided with violent cyclical bear markets in the major market averages or cyclical/secular bear markets in gold. With gold appearing to be ending its recent mild cyclical bear market, there is meaningful upside for Royal Gold to trade back towards a multiple of more than 22x cash flow, where it traded in Q3 2019 and Q2/Q3 2020. The below charts are shown as of January, so these numbers are slightly dated but still show that Royal Gold trades at a discount to its peer group from a cash flow multiple and P/NAV standpoint.

Royal Gold Price – Historical Cash Flow Multiple (Company Presentation)

Historical P/NAV / Cash Flow Multiples (Company Presentation, Author’s Notes [Black])
Given that Royal Gold trades at less than 17x FY2022 cash flow estimates and less than 14x FY2023 cash flow estimates, I see meaningful upside for the stock medium term and long term. In fact, I would not be surprised to see the stock head above $145.00 per share in the next 12 months to re-test its prior all-time high. This is because while the gold price may be lower than Q3 2020 levels when the stock hit its prior all-time high ($147.64), the company’s annual EPS has grown considerably and will grow even further in FY2023. So, for investors for a safe way to play the precious metals space in an inflationary environment, RGLD makes for an excellent buy-the-dip candidate.
So, is the stock a Buy?
Given the volatility in the precious metals space, I generally prefer not to buy after sharp rallies. Instead, I aim to buy on ugly down weeks or when a name is temporarily out of favor. After a 12% gain last week, Royal Gold may have broken out above its 18-month downtrend line, a positive development, but has now found itself just above the middle of its trading range. This is based on the stock having upper support at $100.50 and resistance at $135.45.
When entering new positions, I prefer a reward/risk ratio of at least 3 to 1 for royalty/streaming companies, ideally 3.5 to 1. After last week’s rally, RGLD no longer meets this criterion, with a current reward/risk ratio of 0.79 to 1.0. This suggests we are now outside of the low-risk buy zone. However, if RGLD were to correct below $107.50, it would meet this criterion (3.5 to 1), and this would offer a much lower-risk area to start a position in the stock. So, while I am not long the stock yet, this is an area where I would strongly consider buying the dip.

RGLD Daily Chart (TC2000.com)
While Khoemacau may be slightly behind schedule, the silver lining is that Royal Gold has picked up a 100% silver stream (90% previously) on the project, and we’ve seen other positive developments, like Sabina’s (OTCQX:SGSVF) recent financing. This is yet another pillar for growth for RGLD looking out to 2025, and investors have an exciting few years ahead as RGLD’s GEO volume should grow steadily as new assets come online. With copper, gold, and silver prices also firming up, this should translate to meaningful growth in annual EPS over the next few years. In summary, I see RGLD as a solid buy-the-dip candidate, and I would view any pullbacks below $107.50 as buying opportunities.