
DarrelCamden-Smith/iStock via Getty Images
It’s been a turbulent start to the year for the major market averages, with the Nasdaq 100 Index (QQQ) falling 10% and the S&P-500 (SPY) down 6% year-to-date. Fortunately, unlike Q1 2020, gold (GLD) has been a safe haven during the decline for the time being, down less than 1%, and royalty/streamers like Royal Gold (RGLD) have also been giving up ground grudgingly.
Royals Gold’s recent outperformance is likely tied to the fact that it’s overdue to play catch up relative to its larger peers, and that it has strong earnings growth on the horizon. This is based on Khoemacau Mine ramping up to ~7,000+ tonnes per day this quarter (70% of its targeted 10,000 tonne per day mining rate). Given Royal Gold’s strong track record and enviable project pipeline, I would view any pullbacks below $98.20 as low-risk buying opportunities.
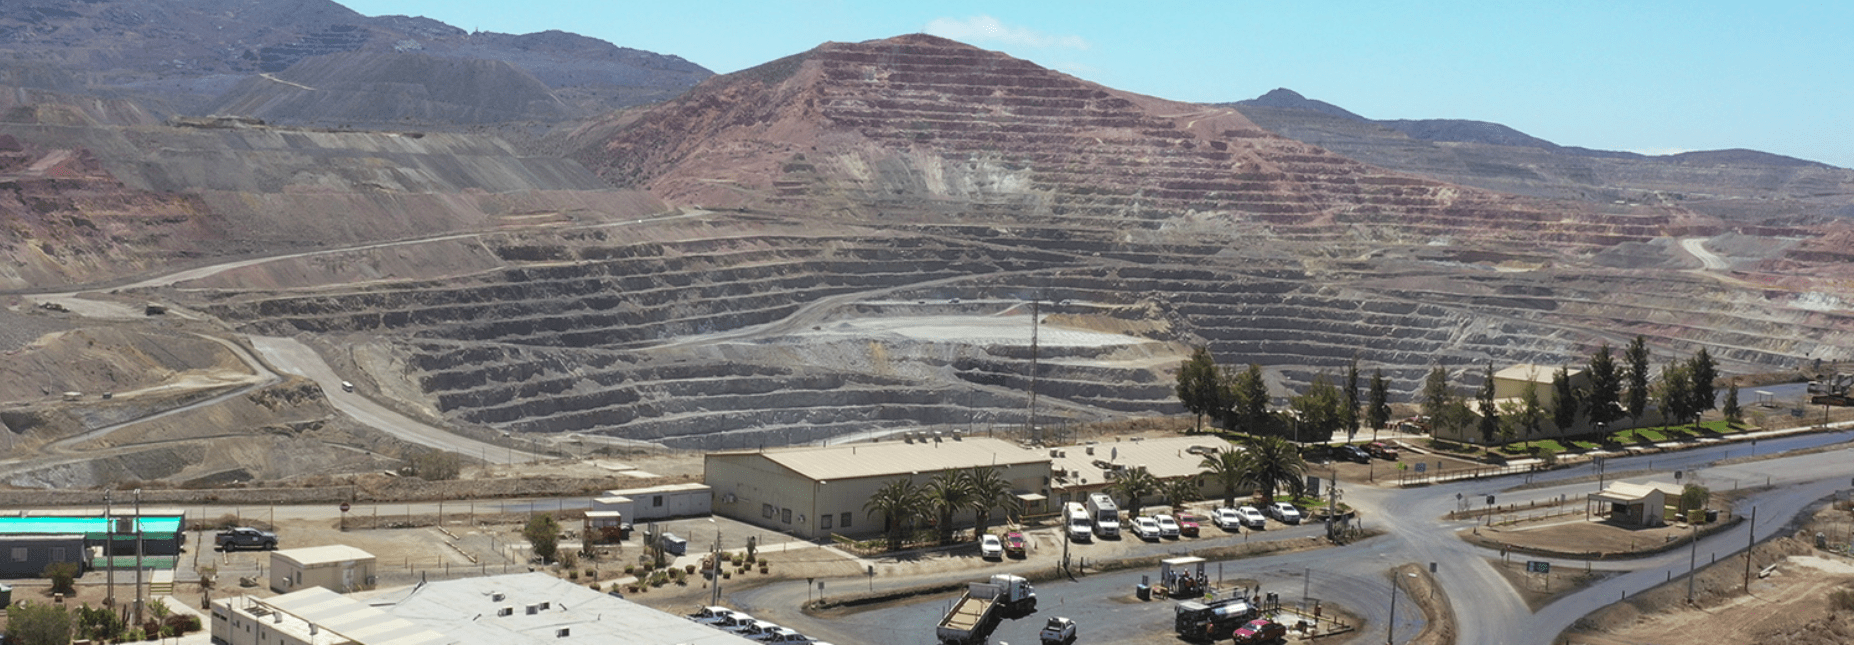
Andacollo Mine (Teck) – 100% Gold Stream held by RGLD (Company Website)
While Wheaton Precious Metals (WPM) and Franco Nevada (FNV) have put together two strong years of performance (110% and 82% total returns), Royal Gold has lagged since February 2019, with a total return just shy of 25% in the same period. This underperformance can be partially attributed to Franco Nevada’s higher gold-equivalent ounce volume growth rate in the period and oil/gas exposure which has paid off. Meanwhile, Wheaton has benefited from its silver exposure and superior GEO volume growth as well.
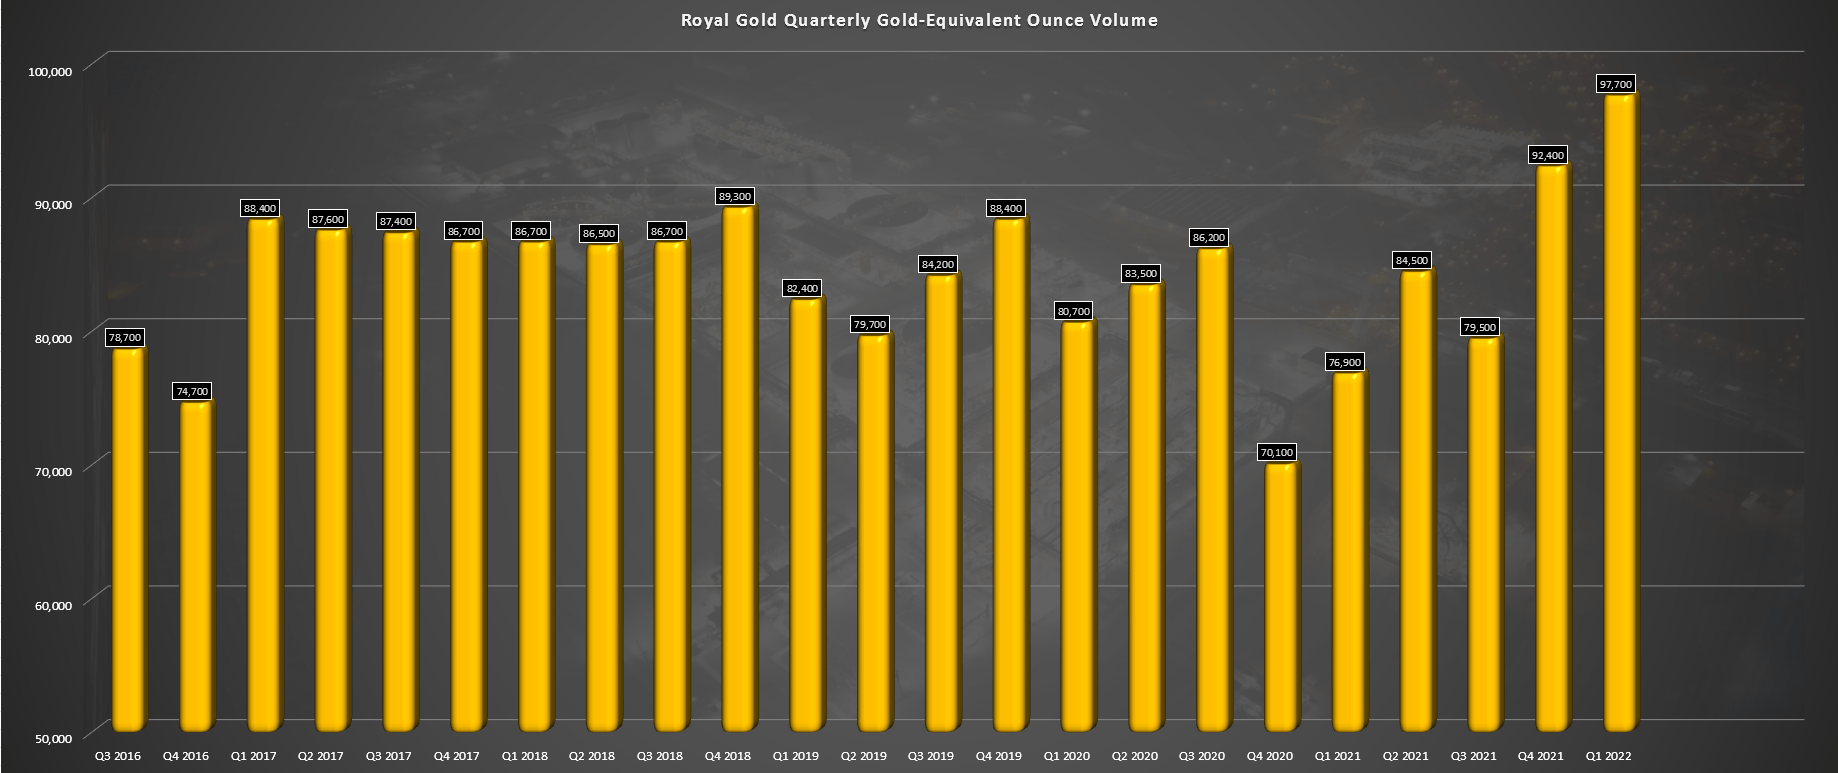
Royal Gold – Quarterly Gold-Equivalent Ounce Volume (Company Filings, Author’s Chart)
However, RGLD has lagged in GEO growth and performance because it paid for significant growth ahead of time but was waiting to bear the fruits of this transaction. This transaction was the massive silver stream on the high-grade Khoemacau Copper Mine in Botswana, which has a 21-year mine life and is expected to produce an average of ~62,000 tonnes of copper and 1.9 million ounces of silver per annum. Based on Royal Gold’s recently increased 90% payable silver stream, this translates to attributable production of ~23,000 GEOs per annum or nearly 8% growth vs. Royal Gold’s FY2021 GEO volume of ~333,000 GEOs.
It’s worth noting that there is an upside to this attributable production profile, with a potential mill expansion to 13,000 tonnes per day that would boost production even further at this massive asset. While Royal Gold would pay higher ongoing cash payments for ounces delivered in excess of specific annual thresholds, its current structure is very favorable, paying just 20% of the spot price of silver ($4.60 per ounce at current prices) per ounce produced. With this deal expected to translate to incremental annual revenue of $42+ million at an estimated $25.00/oz silver price in FY2023 (FY2021 revenue: $615.9 million), this should provide a healthy boost to Royal Gold’s revenue.
Organic Growth
While Khoemacau certainly provides a nice boost, additional organic growth in the portfolio cannot be understated. At Red Chris, Royal Gold has secured a 1.0% net smelter return [NSR] royalty on all metals at the massive British Columbia copper-gold mine. Newcrest’s (OTCPK:NCMGF) recent study has shown that production could average ~316,000 ounces of gold and ~80,000 tonnes of copper from FY2029-FY2034 once it transitions to block cave mining (FY2027 expected start date). Based on current gold and copper prices, this would translate to ~$14 million in annual revenue. I would argue that given the attractive fundamental backdrop for copper prices in the trend towards electrification, the $9,800/tonne price might end up looking conservative later this decade.
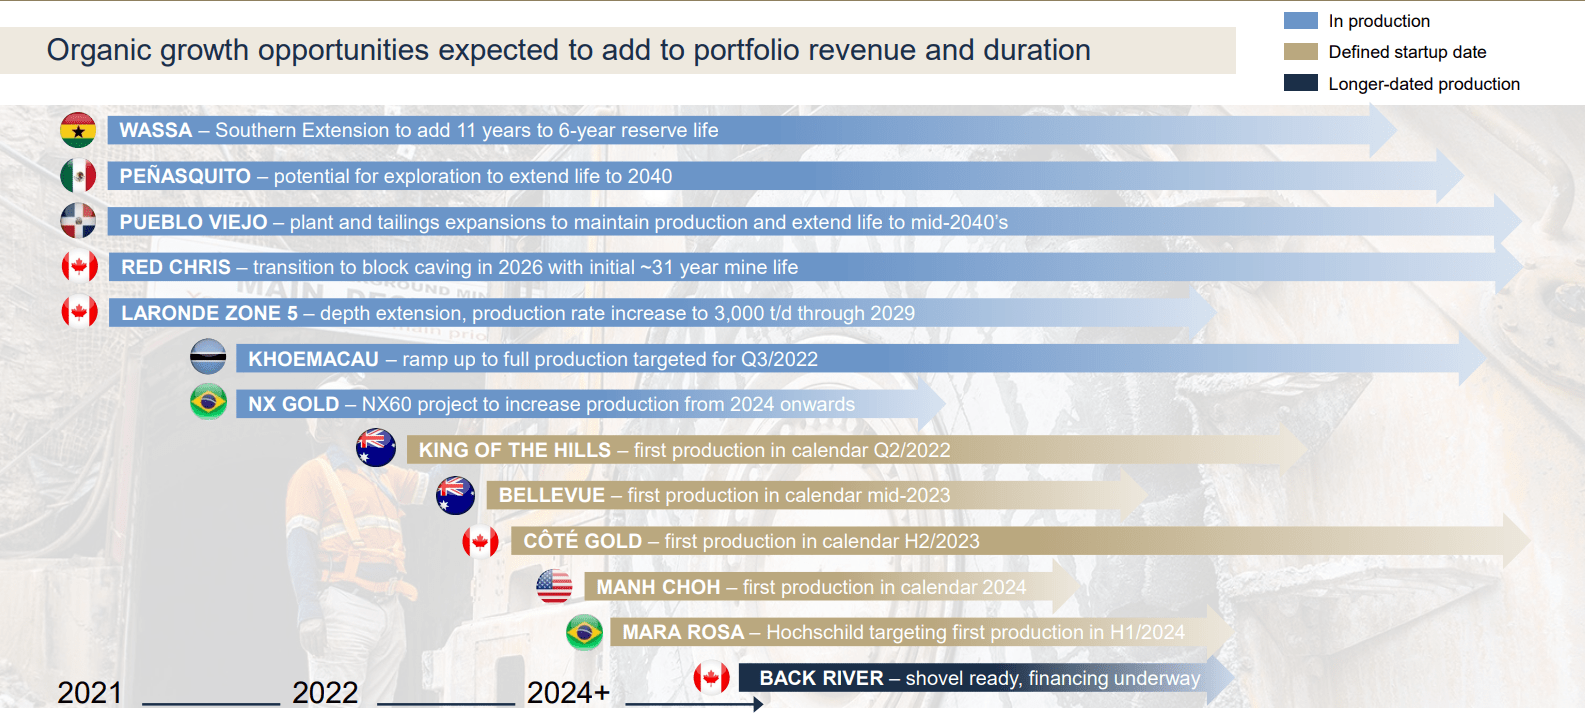
Royal Gold – Organic Growth Potential (Company Presentation)
Meanwhile, Royal Gold also has meaningful growth from Cote Gold in Ontario, Canada, holding a 1.0% NSR royalty on the Chester 3 Mining claims, which are estimated to contain ~70% of the current mineral reserves at the project. Cote Gold is expected to begin commercial production in 2024, producing an average of ~488,000 ounces per annum over its first five years. This should translate to incremental production of more than 3,200 GEOs per annum.
Elsewhere, within the development phase/production ramp-up phase, Bellevue’s (OTCPK:BELGF) Bellevue Gold Mine, Evolution’s (OTCPK:CAHPF) Bateman Mine, Hochschild’s (OTCQX:HCHDF) Mara Rosa, Nevada Gold Mines’ Goldrush, Kinross’ (KGC) Manh Choh, and Red 5’s KOTH have the potential to add a combined ~19,000 GEOs per annum by 2025. This would be similar to adding another Khoemacau to the portfolio, but this contribution comes from several smaller assets. With most of these assets being a high priority for their operators, I expect the majority to be online by 2025.
Finally, in the producing portfolio, the Wassa Mine in Ghana has excess processing capacity sitting idle. There is the possibility that annual production could increase to ~290,000 ounces per annum based on the Southern Extension PEA. This study was completed by Golden Star (GSS) before it was acquired by Chifeng Lifong Gold Mining last year. So, while a mine life extension at Wassa already looked likely, a boost to production could be in the cards in the coming years as well, boosting Royal Gold’s attributable production from its gold stream on the asset.
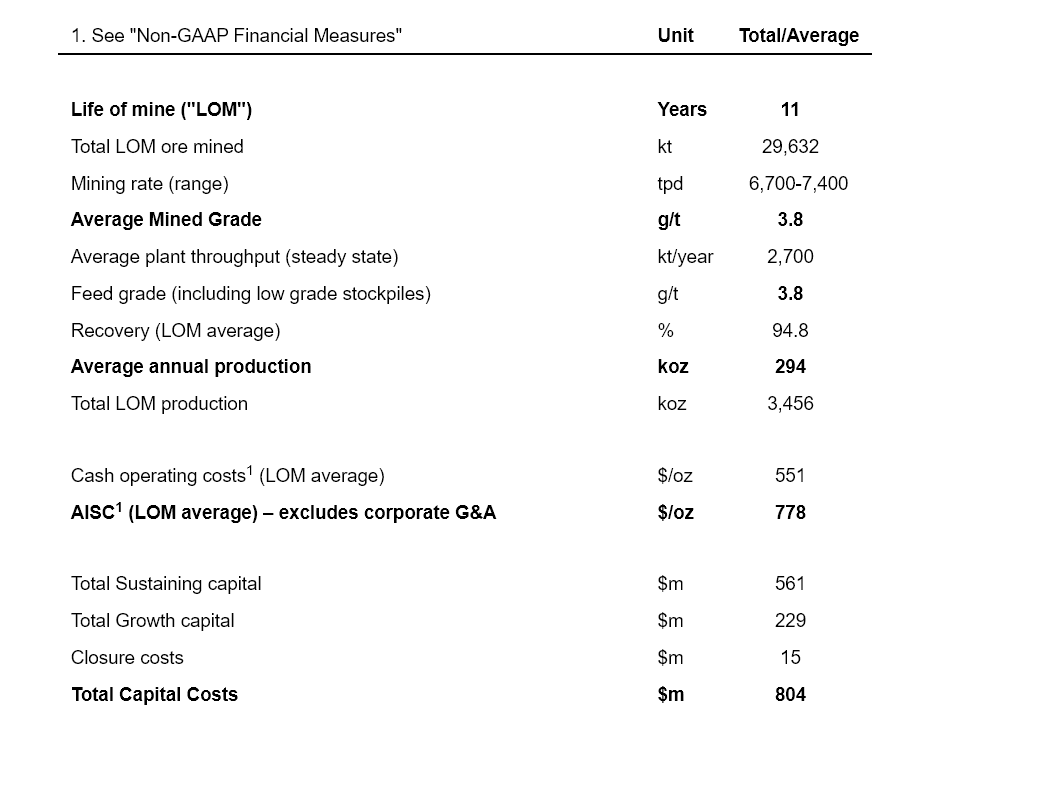
Golden Star Resources Technical Study – Wassa (Company News Release)
Based on this organic growth potential, I would argue that Royal Gold’s current earnings and FY2022 earnings estimates understate its true earnings power, with the potential for meaningful growth looking out to FY2025. However, even without this growth, we can see that RGLD’s earnings trend is set to improve meaningfully in FY2022, with annual EPS expected to come in at $4.25, up nearly 18% year-over-year. This continues a track record of industry-leading compound annual EPS growth, with Royal Gold’s compound annual EPS growth rate sitting at ~20.8% since FY2014, assuming it can meet current FY2022 estimates ($4.25). Let’s take a look at the valuation below:
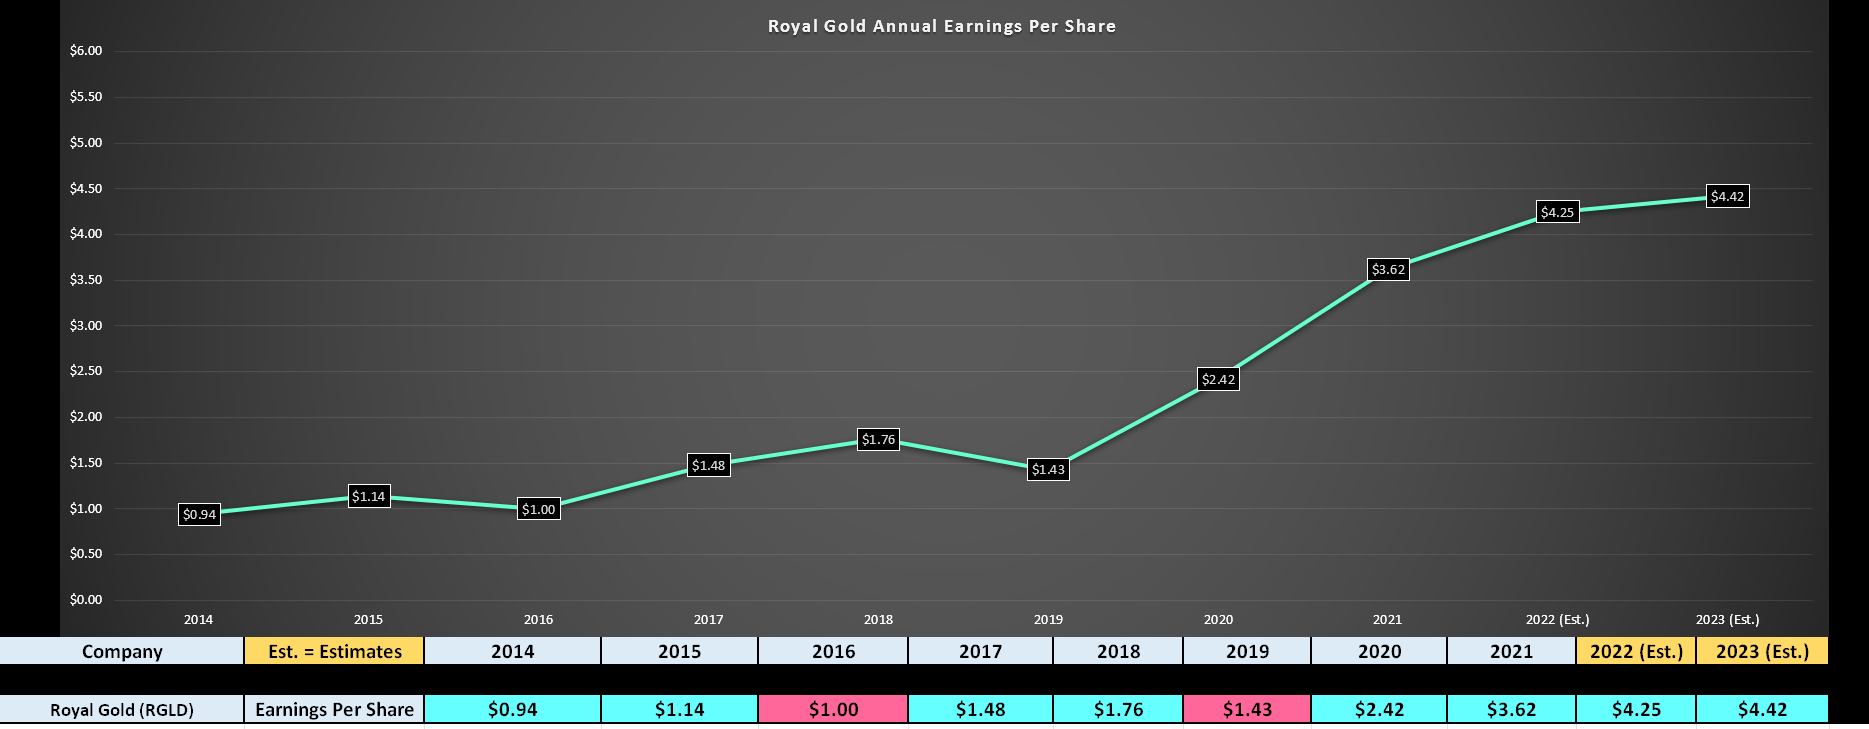
Royal Gold Earnings Trend (FactSet.com, Author’s Chart)
Valuation & Technical Picture
Looking at the chart below, we can see that Royal Gold has a strong track record of growing its dividend. In fact, it has grown its dividend every year since 2004, making it a near Dividend Aristocrat, which is very rare to find in a cyclical sector. Notably, it has also maintained a conservative payout ratio of 19%, suggesting a high likelihood of further dividend growth on the horizon. Despite this distinction, Royal Gold trades at just ~24.2x FY2022 earnings estimates, a massive discount to its historical earnings multiple that sits closer to 50.
I would argue that it’s ambitious to assume that Royal Gold will trade at an earnings multiple of 50 without significant help from the gold price and a very strong bull market that pushes generalists back into the sector. However, even if we assume a more conservative earnings multiple of 32.5 (35% discount to 20-year average), Royal Gold’s fair value comes in closer to $138.00 per share. This points to a more than 30% upside from current levels, while investors collect a ~1.40% dividend yield.
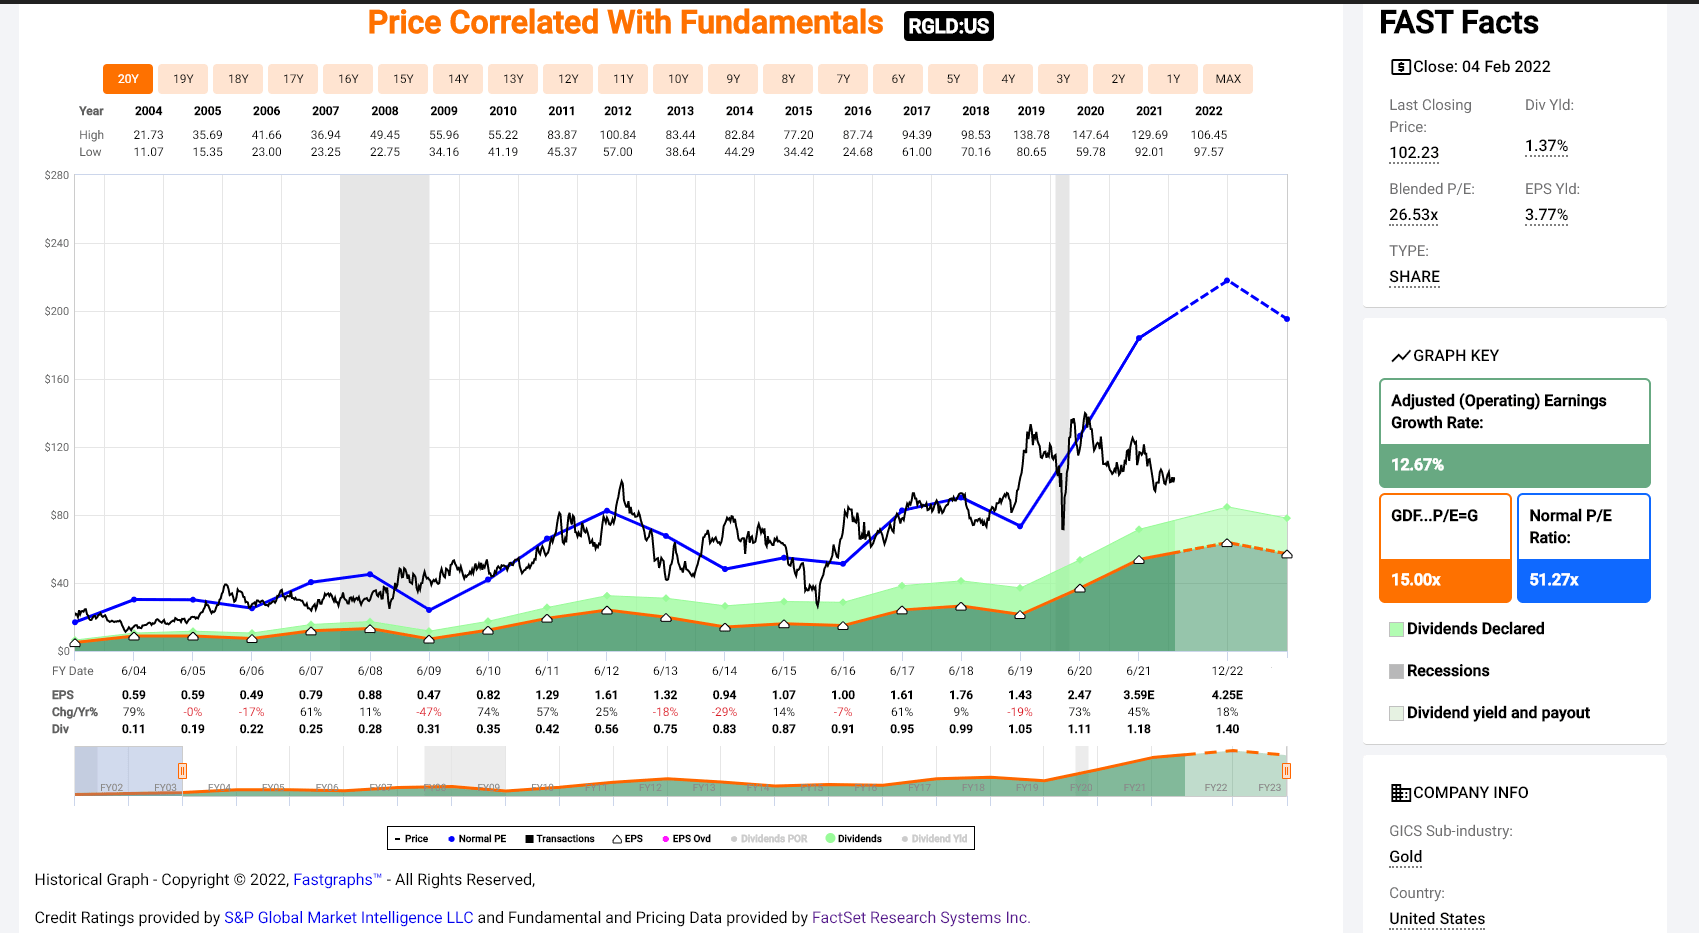
Royal Gold – Historical Earnings Multiple (FASTGraphs.com)
Looking at Royal Gold from a P/NAV and price to cash flow standpoint, we can see that these valuation metrics corroborate the view that the stock is undervalued, with Royal Gold trading at less than 15x cash flow and ~1.7x P/NAV. If we look out over the past decade, the stock has rarely traded at these levels outside of secular bear markets in the gold price and abnormally violent cyclical bear markets (Q1 2020) for the S&P-500 (SPY). With Royal Gold trading only slightly above these levels in a bull market for gold, the stock looks far too cheap at current levels.
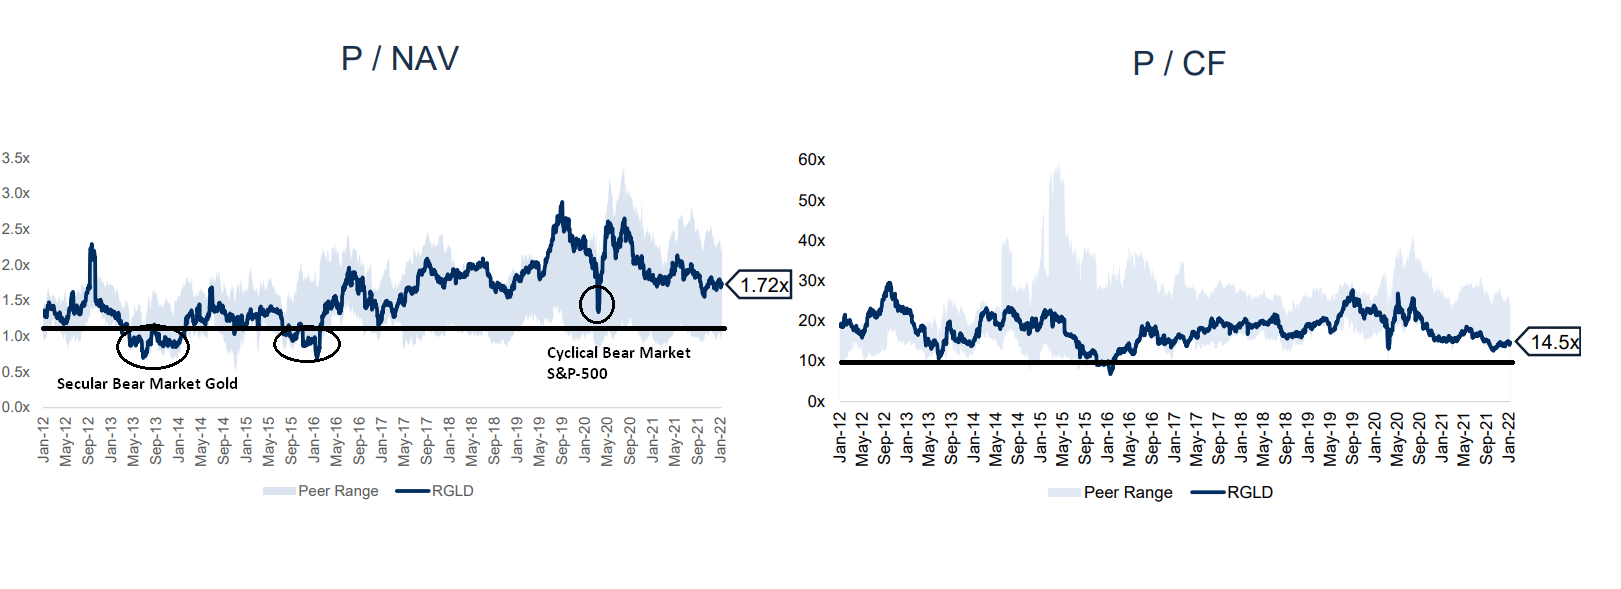
Royal Gold – Historical P/NAV, Price To Cash Flow Multiples (Company Presentation, Author’s Notes [Black])
Moving to the technical picture, we can see that Royal Gold has been consolidating for nearly 18 months now, following its peak in Q3 2020. These long periods of consolidation above the 30-month moving average (green line) have typically presented low-risk buying opportunities (2002-2005, 2006-2008), and the current picture looks quite similar. While past results following these healthy basing periods are not indicative of future returns, I would not be surprised to see RGLD emerge from this consolidation and break out to the upside over the next nine months.
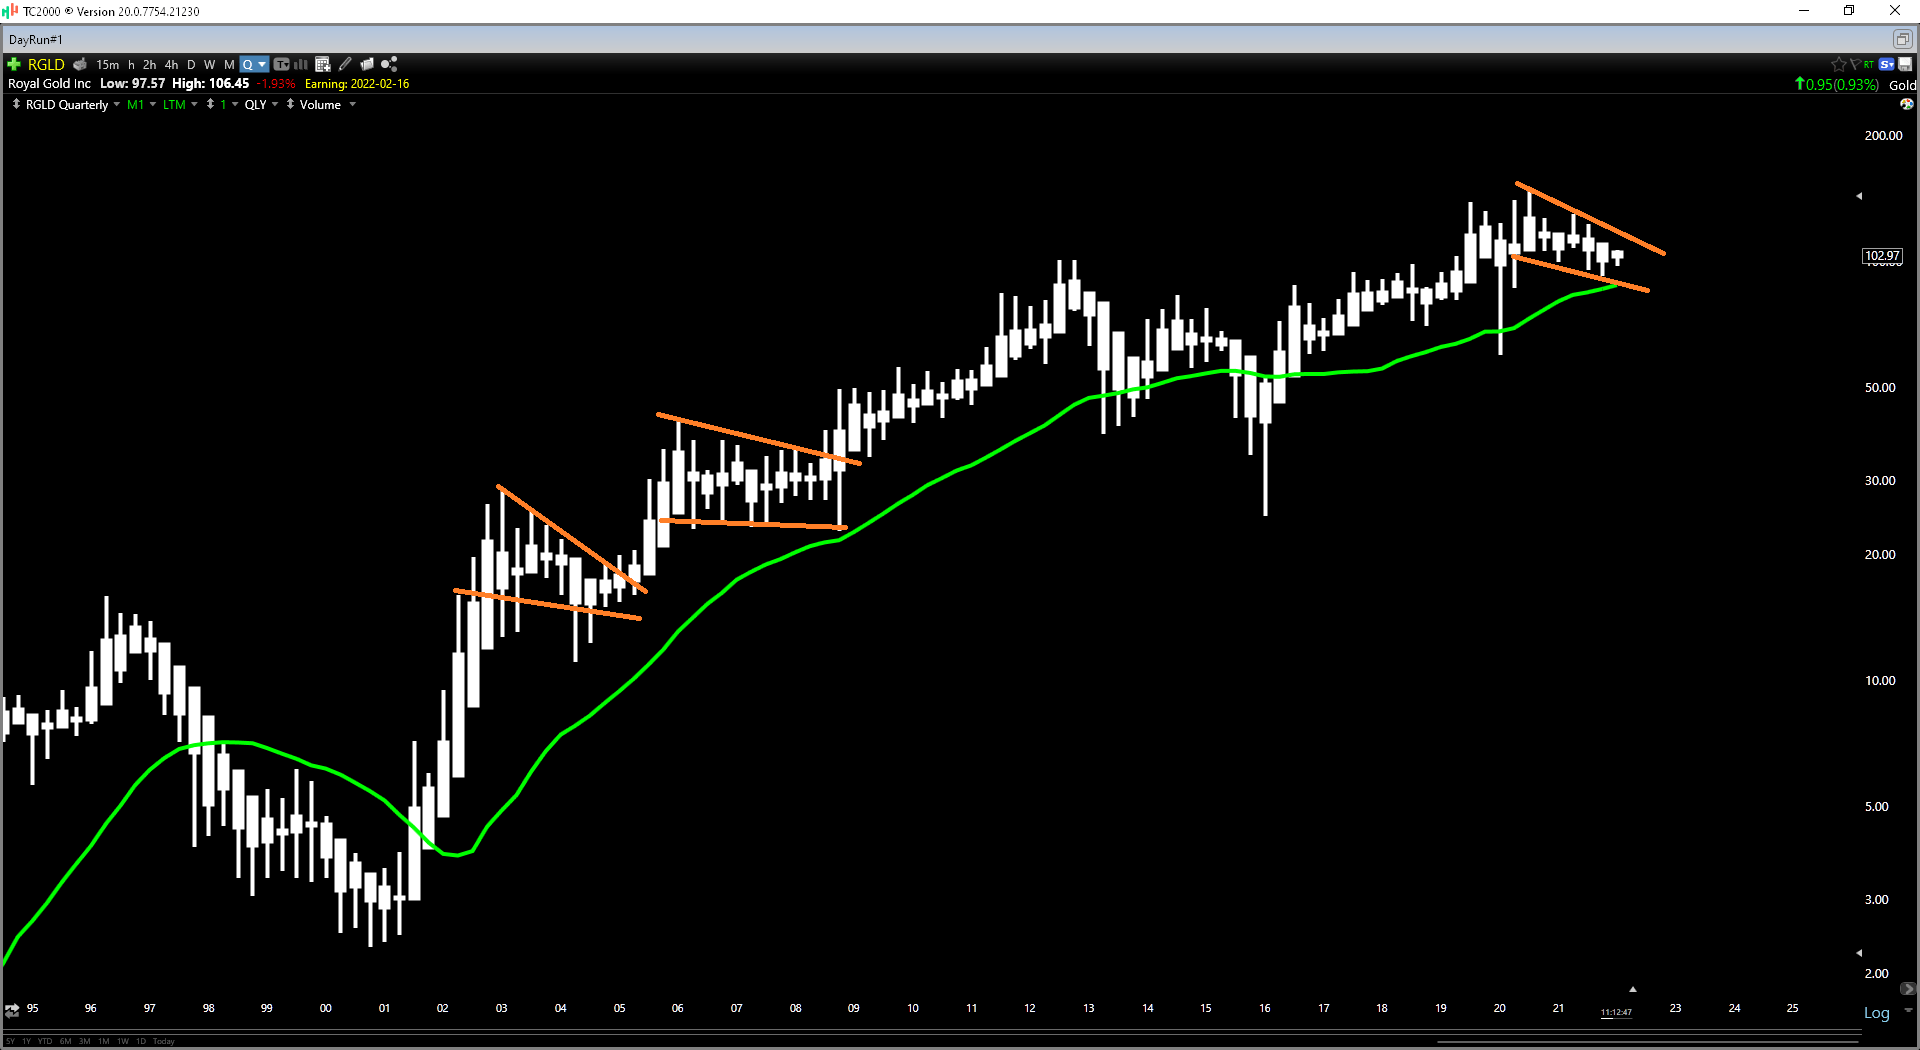
RGLD Quarterly Chart (TC2000.com)
So, is the stock a Buy?
Looking at the shorter-term picture, we can see that RGLD has strong support at $94.00, where buyers came in immediately during October/December. Meanwhile, there’s the potential for short-term resistance at $113.00, where its 18-month downtrend line lies. Given that the stock is sitting in the middle of this trading range at $102.80, it does not quite meet my criteria of a 3.0 to 1.0 reward/risk ratio (distance to support vs. resistance). Instead, the ideal buy point for RGLD is at $98.20 or lower, where the stock has just $4.65 in potential downside to support ($93.50) and ~$15.00 in upside to its next resistance area.
So, while the valuation remains very attractive and this is an attractive entry point for long-term investors, my preferred area to buy the stock is $98.20 or lower. Obviously, there’s no guarantee that the stock heads this low, and for investors that prefer to start a position and then scale in on weakness, I see this as a suitable initial entry point for a first tranche at $102.80 per share. The bonus is that investors are collecting a small dividend to wait (~1.40%), which is higher than that of the S&P-500 (~1.30%).
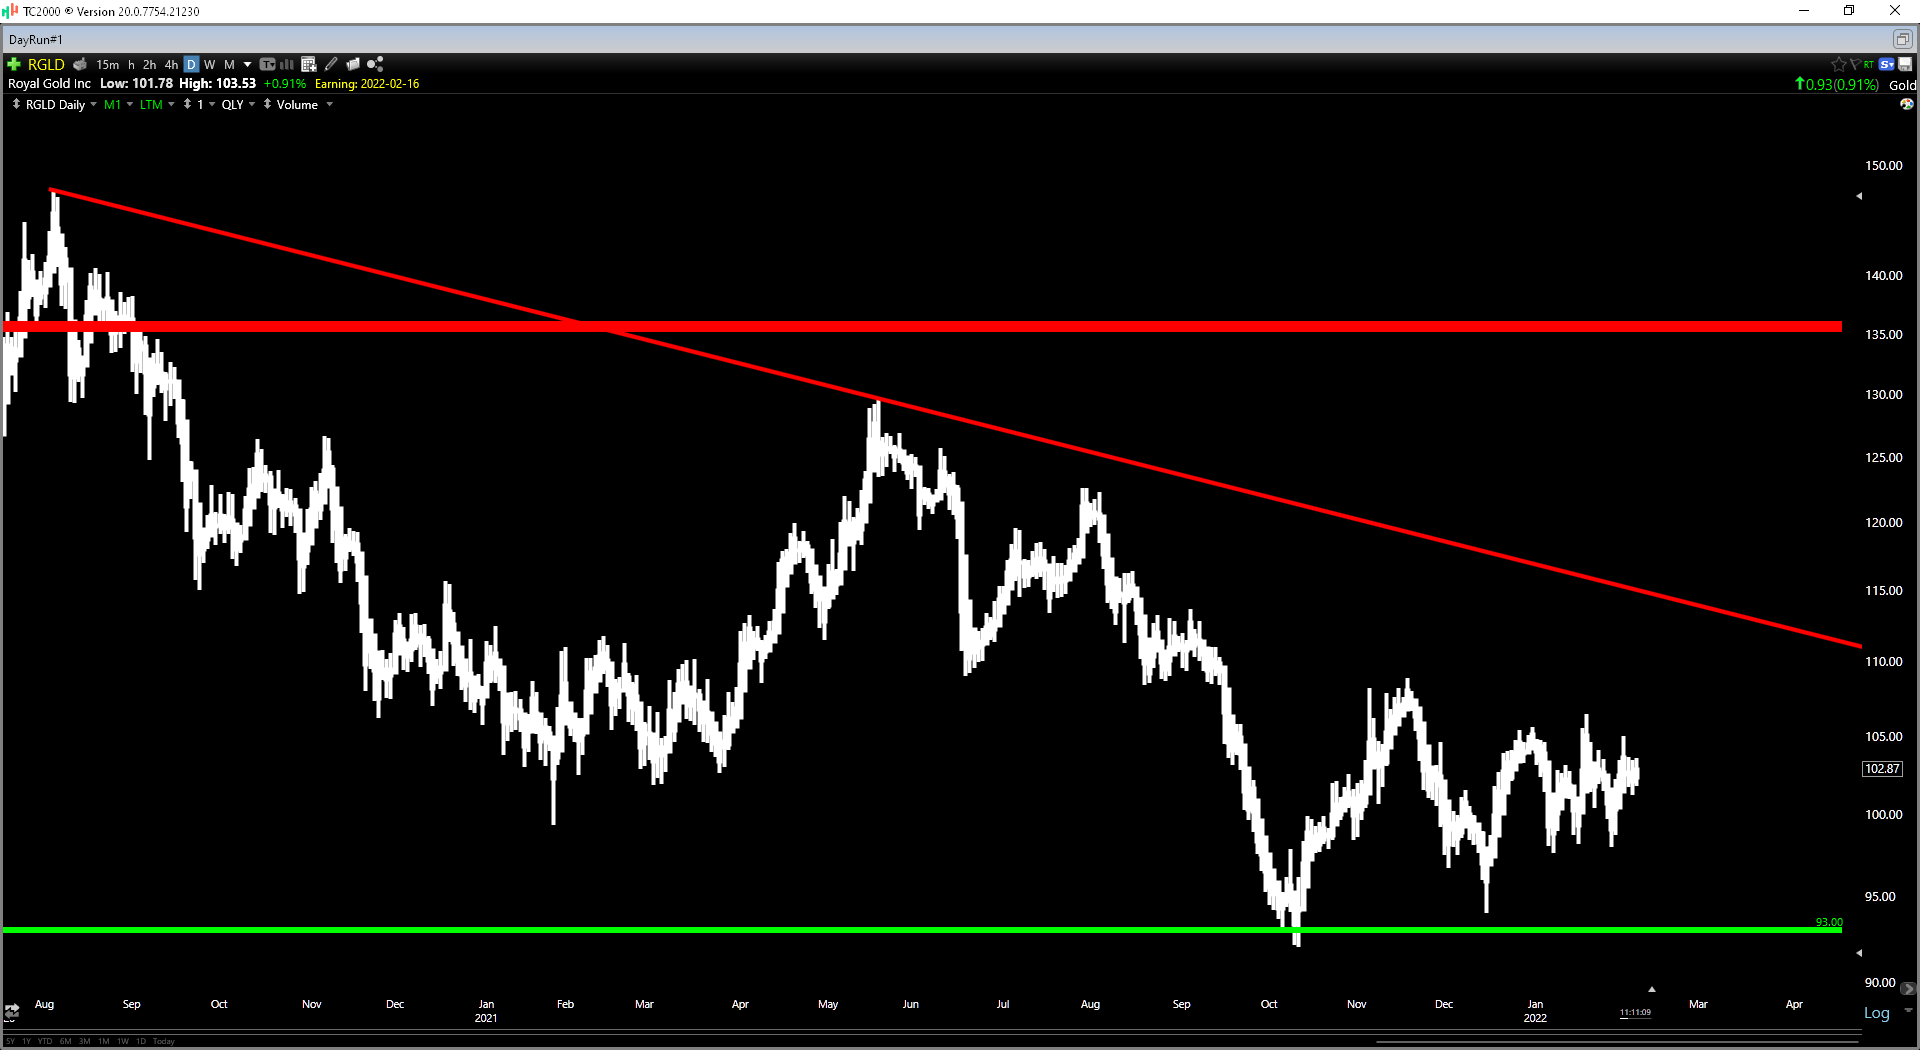
RGLD Daily Chart (TC2000.com)
While investors in RGLD have seen relative underperformance vs. some of the other royalty/streaming producers, the company is set up for double-digit annual EPS growth this year, with even better growth if gold can wake up from its slumber. Meanwhile, though the royalty/streaming space is becoming more competitive with new entrants, I don’t see this as affecting RGLD, FNV, WPM as much, given that they are typically looking at much larger deals than their mid-tier/junior peers. To summarize, I continue to see Royal Gold as a staple for any precious metals portfolio, and I would view any pullbacks below $98.20 as low-risk buying opportunities.