

Good morning. Sometimes, when you write about finance, you have to sit down and build yourself a big ol’ spreadsheet, fill it up with individual data points, and see if it teaches you anything. If nothing else, it reminds you that the big trends you blather on about are made up of little bits of information, many of which are not doing what the big trend says they’re supposed to be doing. Anyway, yesterday was a spreadsheet day. What I learnt below. Email me: robert.armstrong@ft.com
Margins are going to be fine
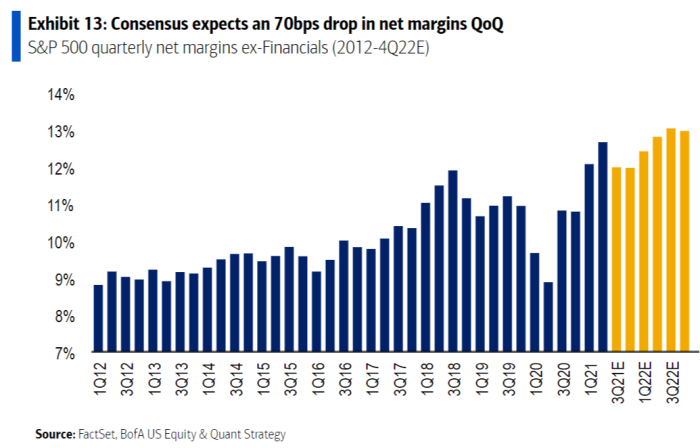
Yesterday I wrote a bit about this chart of quarterly net margins on the S&P 500 (not including financials), which comes from Bank of America. The yellow lines are what Wall Street expects:
There are several interesting things about that chart:
-
The strong upward trend in net margins over the past decade or so;
-
The fact that the trend looks like it might have peaked and turned over in the third quarter of 2018, before Covid hit;
-
The fact that in the first two quarters of 2021, margins surpassed their pre-Covid peaks — by a lot;
-
The fact that analysts seem to expect margins, after falling a bit at the end of this year, to wider still more in 2022.
For an ageing paranoid such as myself, who always thinks the party is about to end, those expectations of ever-better margins look Panglossian. But I wondered: a) where on the income statement the higher net margins are coming from — lower expenses? Lower interest expense? And b) which industries are seeing their profitability increase the most?
So, using data from S&P Capital IQ, I first looked at the composition of the margin increase. Here is what I found (like BofA I excluded financial companies, whose margins are often high, but meaningless; their profitability is better measured by return on capital). I looked at margins in the extraordinary first half of this year and compared them to margins in the first half of 2019, before the pandemic. Then, net margins were 9.3 per cent; they have widened by almost 2 percentage points — which amounts to $184bn more net profit for S&P companies in this year’s first half than in 2019’s.
(You will notice that BofA’s margins numbers in the chart are a point or two higher than mine; I assume there is a difference in methodology; but in any case the trends are parallel.)
Here is how the margin increase was achieved:

Of the 1.8 percentage point increase in net margins over two years, the great majority flowed from higher gross margins (that is, revenue less cost of goods sold). Non-operational factors (non-cash depreciation, taxes, interest payments) hardly mattered. Nor does it look like (possibly unsustainable) cost-cutting inflated the bottom line. The gap between what it costs companies to produce things and what they can sell them for has increased. This is what happens at strong companies, and this chart should encourage investors.
Now, for context, here is the same chart, but comparing margins in this first half of this year to a decade before, in the first half of 2011 (note here that this is the same set of companies in both periods — that is, this is the change in margins over 10 years for companies currently in the S&P):
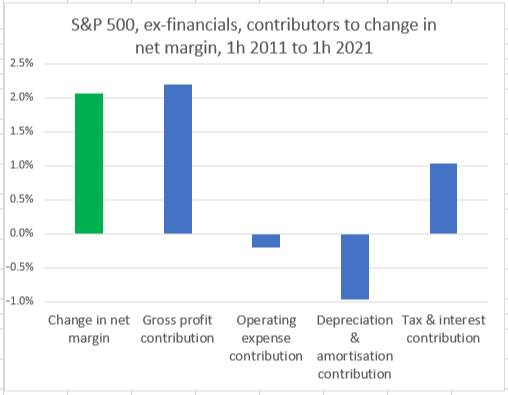
Same story again, roughly. Gross profit is the big driver, expenses and depreciation provide nothing. Here though you can see the impact of the Trump tax cut that took effect in 2018.
The real story is apparent when you look at which sectors are seeing the most improvement. The key is information technology which, once you spike out financials, generates 25 per cent of the net profit in the index. Here is the composition of the tech sector’s margin change over the past two years:

Tech did well everywhere, but gross margin is the biggest factor, and that is important to the index as a whole, because tech is a big part of the index and tech gross margins are wide to begin with. And the increasing scale and market power of the strongest tech companies probably means that those margins are here to stay.
Another major contributor to the gross margin increase is the consumer discretionary sector. But more than half of that sector’s increase in gross profit, in dollar terms, came from one company: Amazon. Again, much of the margin increase story is down to big tech.
There are cyclical factors, too, of course. Materials companies are minting it right now. And bricks-and-mortar retailers have had a pop in margins that may be temporary. But on the whole, rising margins at S&P companies appear to be down to fundamental profitability, rather than financial fiddling lower down on the income statement, and they are supported by the rise of big tech. I’m starting to think worries about the mean regression of high margins may be overblown.
More on this topic tomorrow.
One good read
The FT’s Seb Payne on “the most precious jewel in Britain’s democracy”.