- Silver prints three-day downtrend near yearly low, recently off multi-day low.
- Bearish MACD signals further downside but Momentum seems to dwindle of late.
- Corrective pullback needs to regain $23.00 to recall the buyers, key Fibonacci retracement and 200-week SMA lure bears.
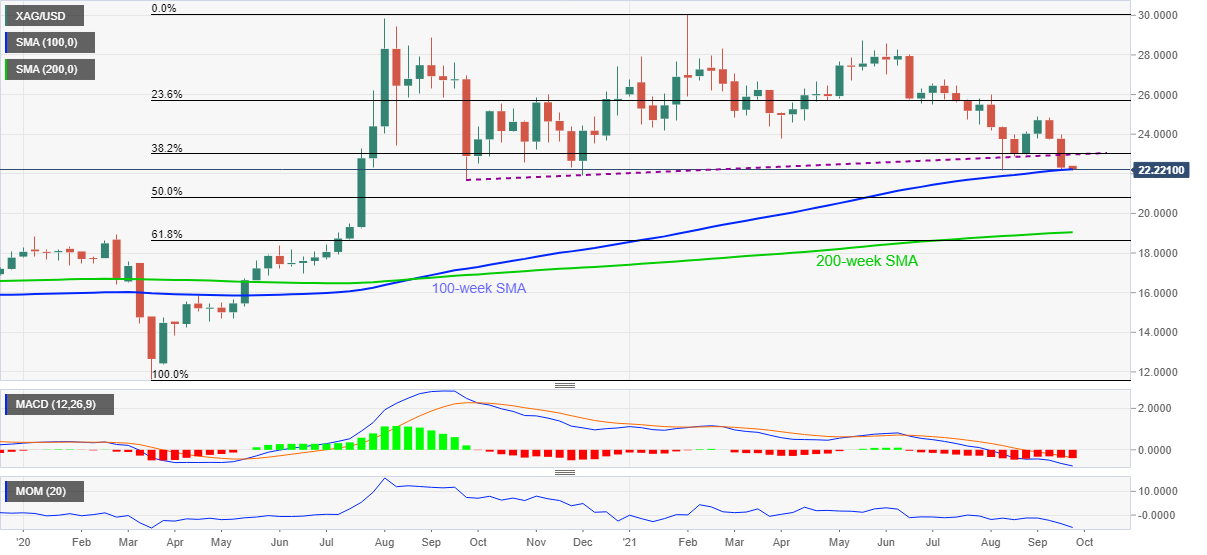
Silver (XAG/USD) sellers tease the yearly low surrounding $22.15-20 amid the initial Asian session on Monday. In doing so, the white metal battles with the 100-week SMA amid bearish MACD signals and a weaker Momentum line.
Although the strong SMA and less-favorable Momentum for further downside challenge the silver bears, the rebound needs to cross the support-turned-resistance line from September 2020, around $23.00, to convince buyers.
Even so, April’s low around $23.80 and the monthly peak near $24.85 adds to the upside filters.
Meanwhile, a clear break of the $22.23 SMA level will direct the CAG/USD prices towards 50% Fibonacci retracement of March 2020 to February 2021 upside, near $20.82.
In a case where the silver sellers keep reins past $20.82, the $20.00 threshold and 200-week SMA near $19.00 will challenge them afterward.
Silver: Weekly chart
Trend: Short-covering move expected


