

- Silver is capped by the 38.2% Fibo retracement level and eyes are n the downside.
- The weekly dojis are about the only bullish prospect on the charts.
Silver is on the brink of a significant move either to the downside or upside according to the following analysis of the weekly and daily charts.
Silver weekly chart
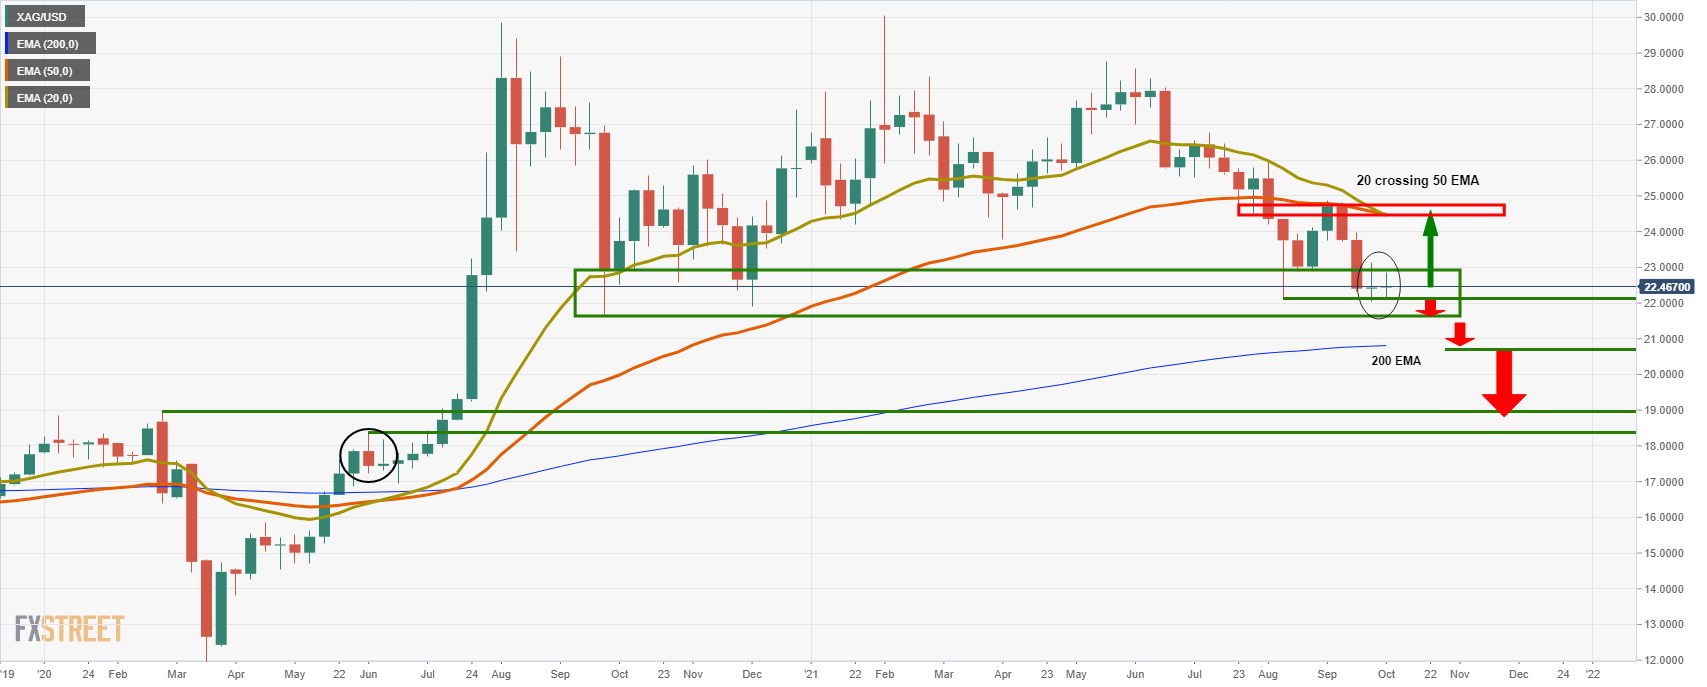
The weekly dojis of last week and in this week’s that is in progress are a bullish prospect for the weeks ahead which could lead to a symbolic move higher. However, the 20 EMA crossing the 50 EMA is compelling and highly bearish as the price hovers over thin ice looking into the abyss. A break here would open risk to the 200-week EMA near $20.82.
Silver daily charts
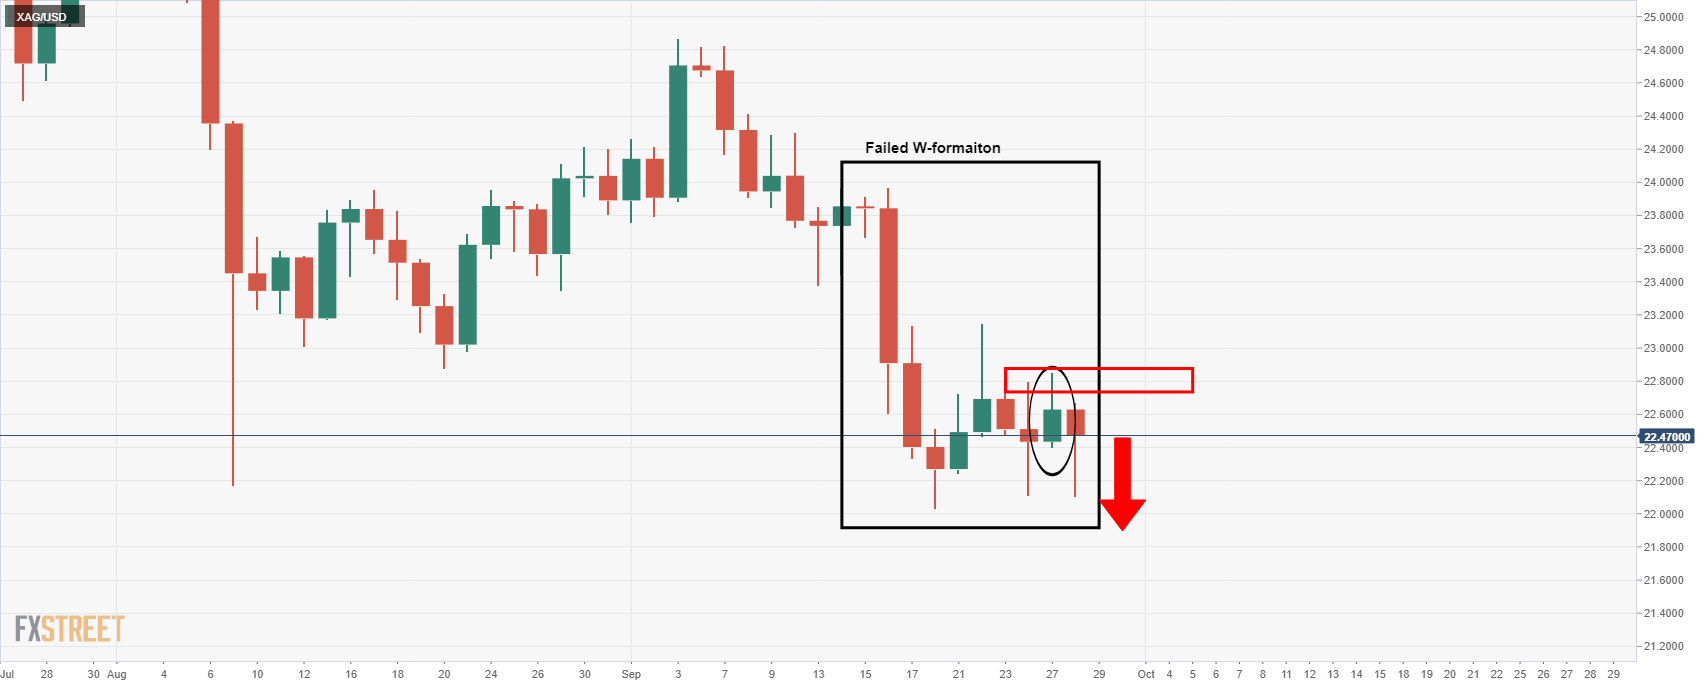
We have seen a failed attempt to move higher in the daily chart and that has resulted in the W-formation running aground in Monday’s candle. That is bearish.
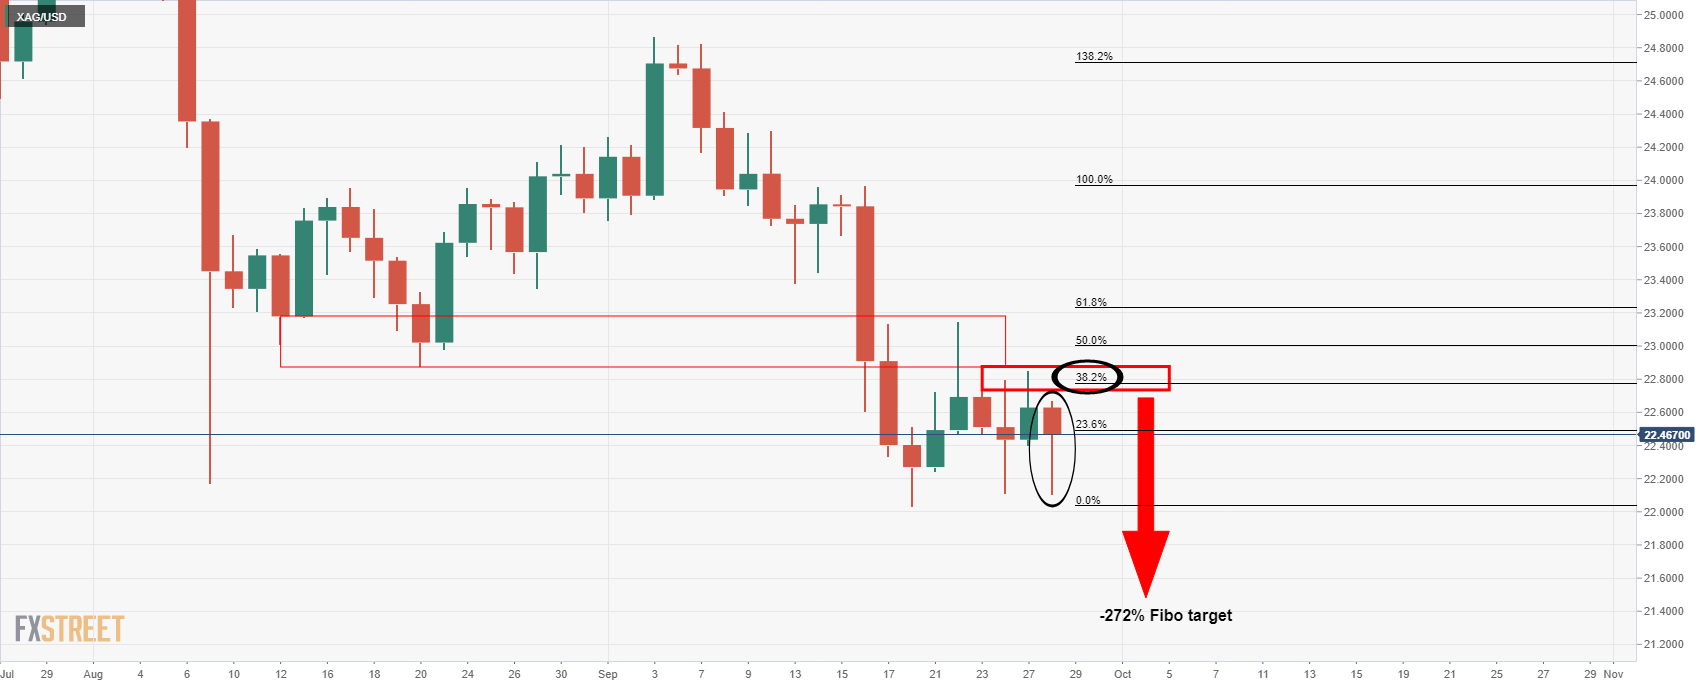
The daily chart is also bearish with the 38.2% Fibonacci offering resistance in the correction and the current daily candle opening prospects of the wick being fille din on lower timer frames for the sessions ahead. The bears can target the -272% Fibonacci retracement of the correction’s range near $21.48 in the first instance ahead of the weekly 200 EMA on a break of the $21 figure.