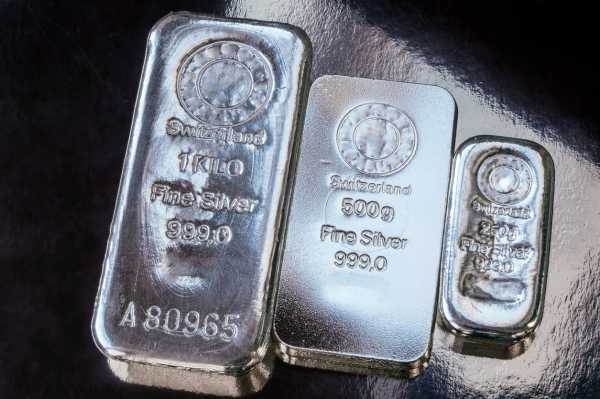
Physical Silver Demand Remains Elevated
Of course, protection from inflation and uncertainty are great reasons to buy and own silver. And as I described above, inflation appears to be coming back with a vengeance. In any case, many investors are hedging against the risk that it becomes entrenched.
In the past 15 months, prices for physical silver are higher than normal. That’s because demand for physical products has remained elevated, leading to sustained high premiums over the spot price. And that’s if you can even get your hands on them. Many of the most popular coins and bars have been persistently out of stock. Premiums are typically 40% or higher, which is nearly triple normal levels.
What’s more, in its recent World Silver Survey 2021, the Silver Institute is forecasting continued strength this year. They expect physical demand to climb by 26% after a very strong 2020. In fact, they foresee overall demand, from all sectors, to be up by 15%, nearly doubling supply growth of 8%.
One area of note is demand from flexible electronics. The Silver Institute indicates demand for silver in printed and flexible electronics is about 48 million ounces annually. They forecast demand will rise to about 74 million ounces in 2030, absorbing 615 million ounces of silver in this decade alone.
As technology becomes increasingly commonplace in our daily lives the world over, printed and flexible electronics are likely to play a bigger role. Consider that wearable electronics like smartwatches, appliances, medical devices and a host of internet-connected devices are exploding in use. Sensors for light, motion, temperature, moisture and motion all make use of printed and flexible electronics.
So, it’s natural that the electronics subsector promises to be the fastest growing demand for industrial silver usage.
Silver’s Seasonal Outlook is Bullish
Another indicator that now may be a great time to be bullish on silver is its seasonal trend.
The following is a 45-year chart, from 1975 to 2020, which averages the annual silver price tendency.
