
by Saad Ullah
S&P 500 Is at Support Line
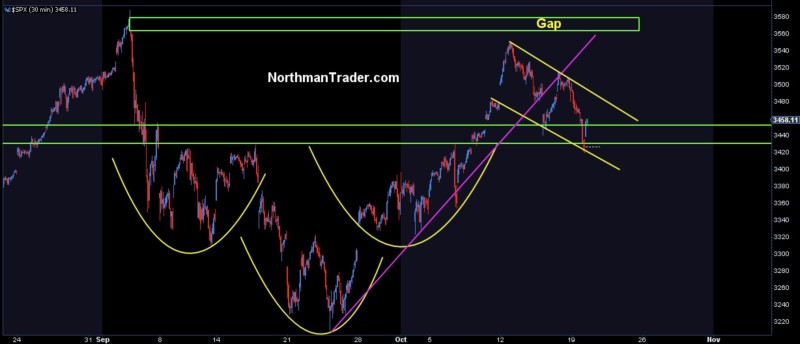
Sven Henrich, market analyst and founder of NorthmanTrader.com, notes that at the moment the S&P 500 index, which includes the 500 largest US companies, has dropped to the support line at about 3430 points.
Bulls defend the back test support. $SPXSven Henrich via Twitter
At the same time, Mr. Henrich states that the S&P 500 managed to rebound from the 5-week Exponential moving average line, which formed the long-term support line for the index chart.
$SPX bounces off of weekly 5 EMA support.Sven Henrich via Twitter
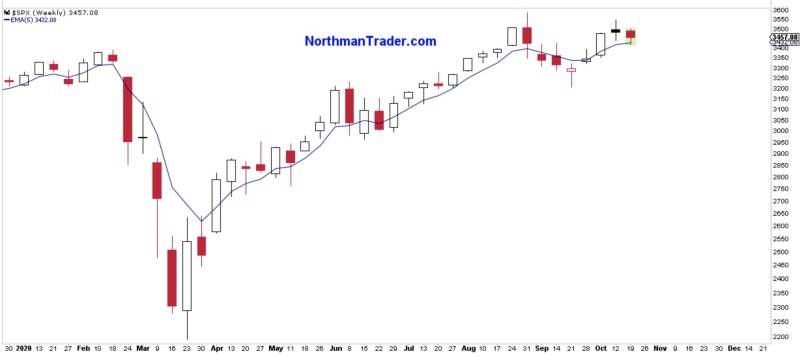
The analyst already noted yesterday that the S&P 500 is at the long-term support level. Today, fortunately for the bulls, the index bounced off the 5-week exponential moving average support line.
What Is EMA Indicator
Exponential moving average is one of the varieties of the Moving Average technical indicator. Unlike its simpler cousin, the SMA, in which each trading day has the same weight, Exponential moving average gives more weight to recent price fluctuations, giving them more weight in the equation. In general, the Moving Average family of technical indicators is used to clear a long-term trend in the market from rather insignificant short-term up and down fluctuations in the price of an asset.
One of the main reasons for the continuing decline this week is the lack of positive news on prolonged economic stimulus for the economy. Two political parties in the United States are unable to agree on a new stimulus package ahead of the presidential election. Earlier, President Trump has already spoken out that his party will not discuss new measures to support the economy with the Democrats until he wins the elections in early November.