Home prices continue to gain, and while the gains were still shrinking in May on a national level, some markets are seeing stronger price appreciation yet again.
Nationally, home prices rose 3.4% annually in May, down from the 3.5% annual gain in April, according to the S&P CoreLogic Case-Shiller home price indices. The 10-city price composite rose 2.2%, down from 2.3% the month before. The 20-city composite showed a 2.4% annual gain, down from 2.5% in April.
“Nationally, year-over-year home price gains were lower in May than in April, but not dramatically so and a broad-based moderation continued,” said Philip Murphy, Managing Director and Global Head of Index Governance at S&P Dow Jones Indices in a release.
Other more recent indexes have shown price gains growing. This particular read is a three-month running average ending in May, so it is less current.
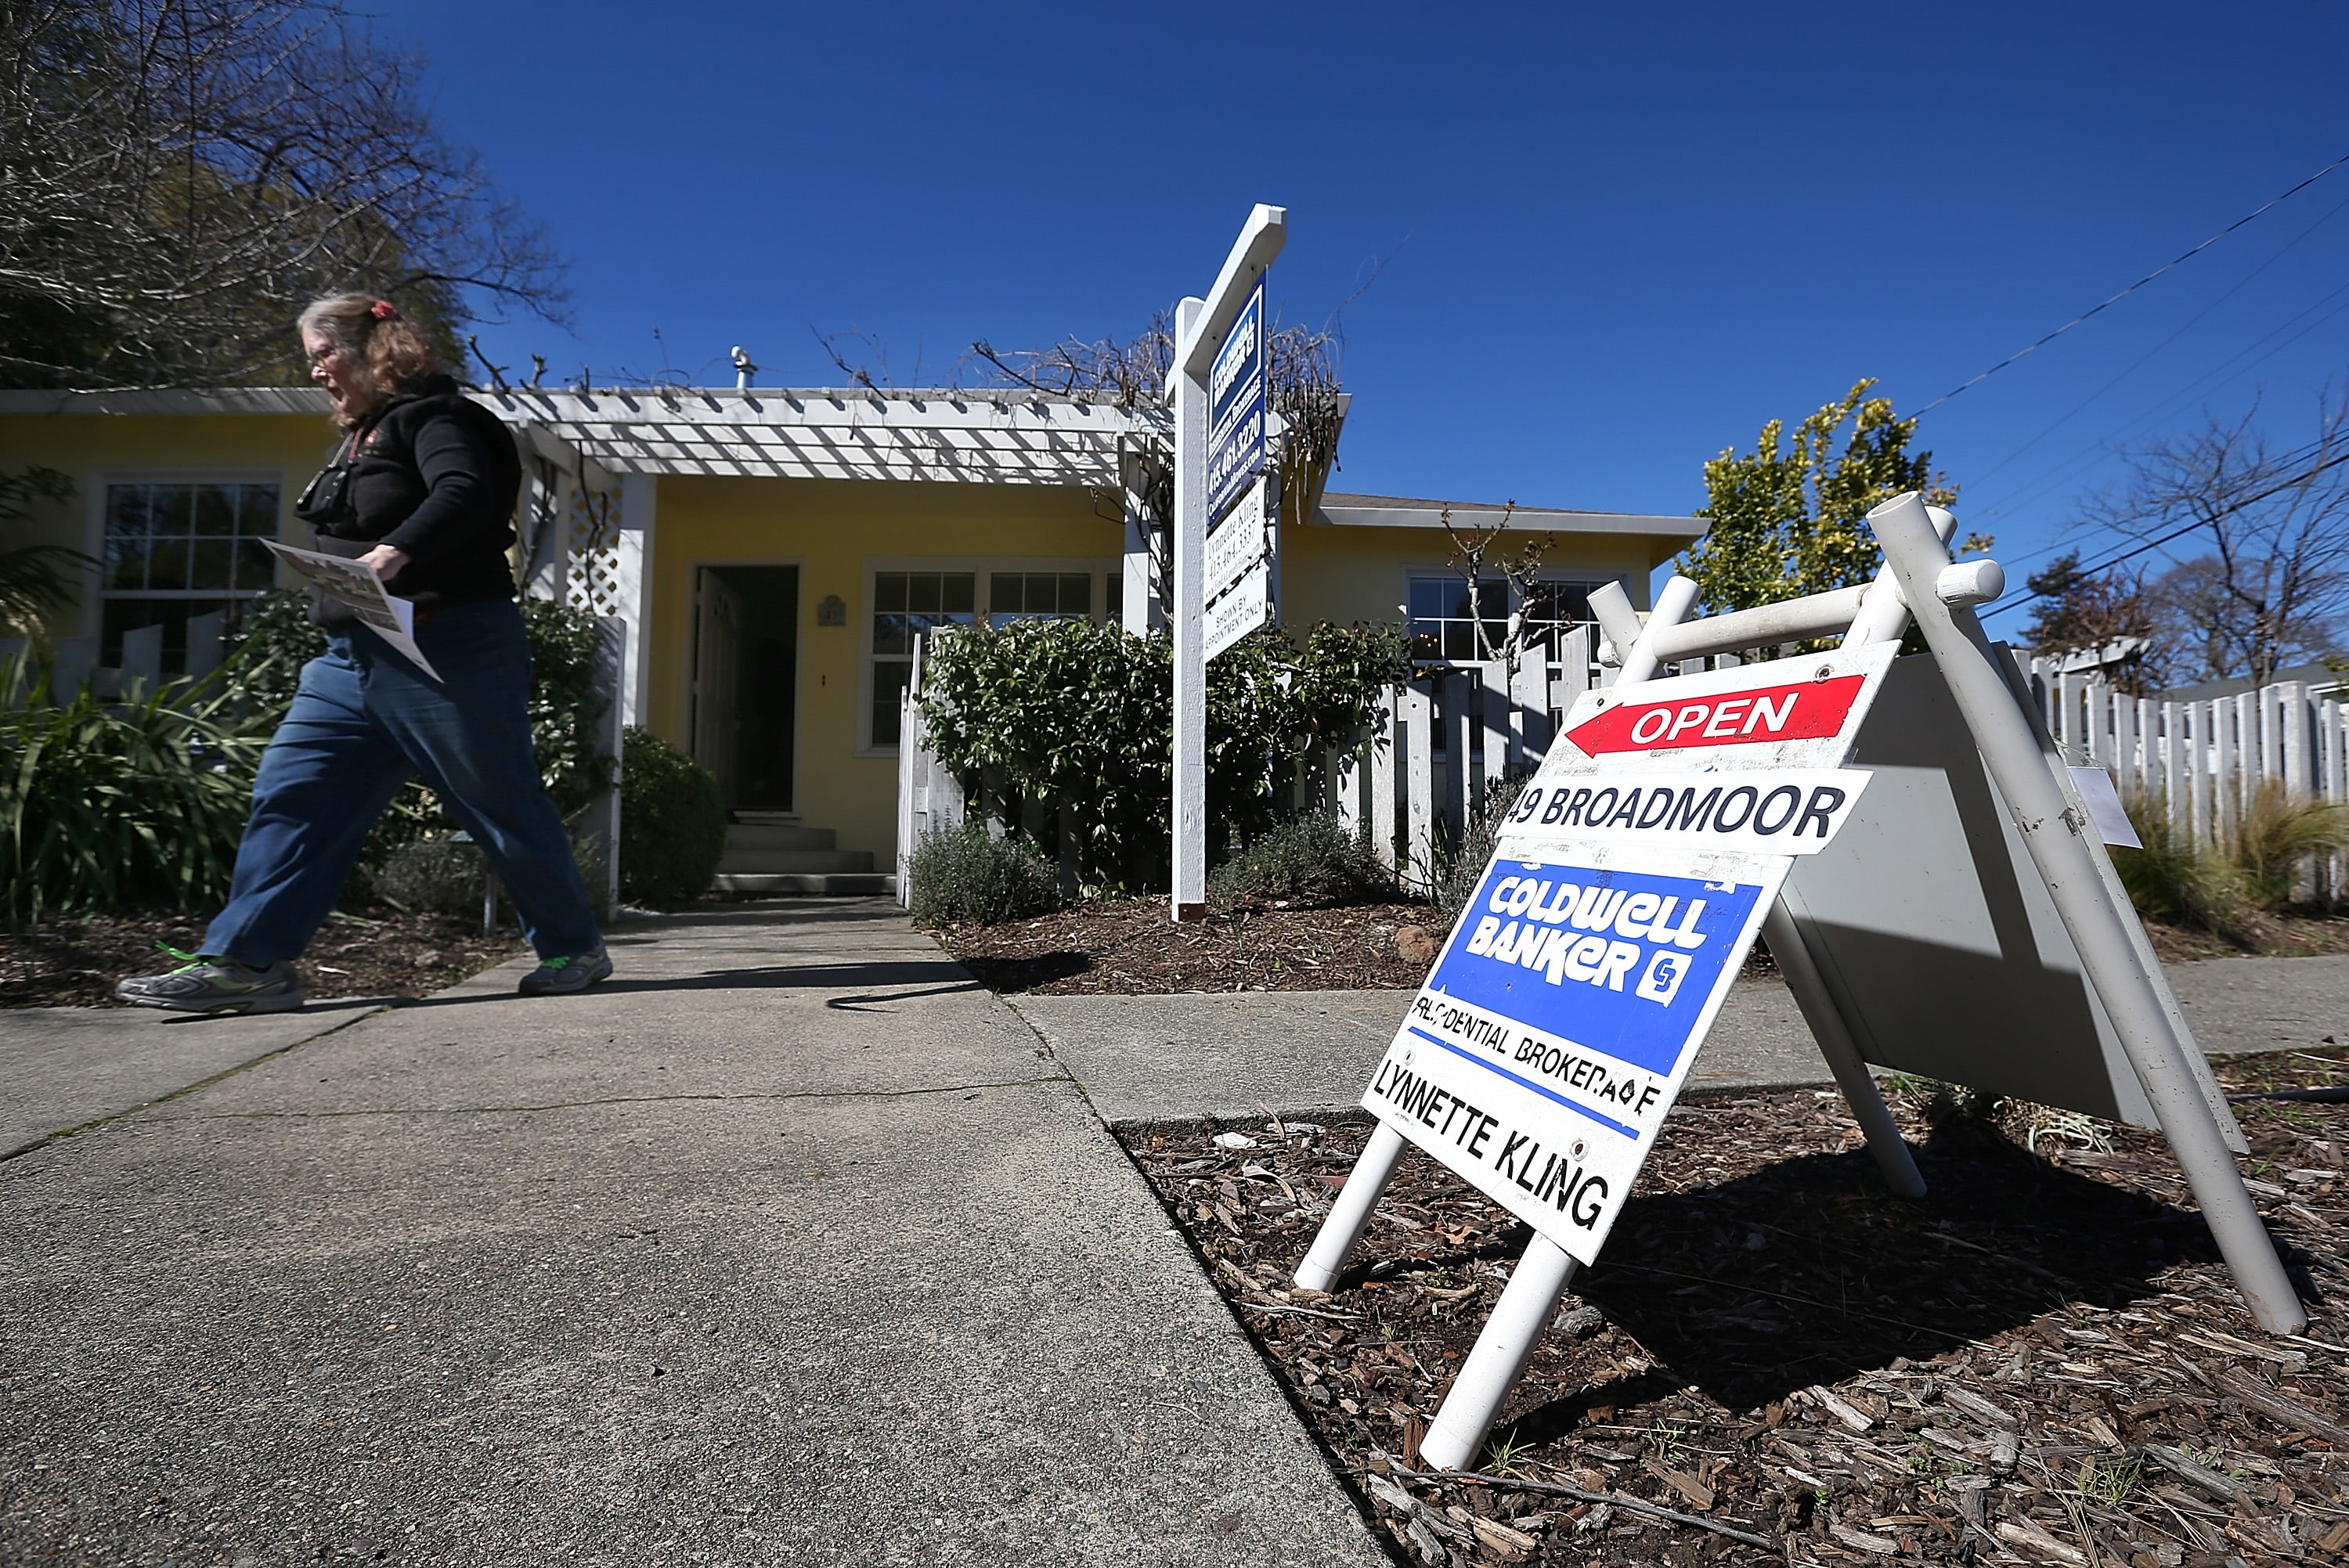
A woman walks out of an open house for a home for sale in San Anselmo, California.
Justin Sullivan | Getty Images
Home prices in some major markets have been heating up due to tight supply of homes for sale. Inventories had been rising at the start of this year but are now flat nationally and lower in some cities, compared with a year ago. Inventory is also most slim on the low end of the market, where demand is strongest.
The median existing-home price in June reached an all-time high of $285,700, up 4.3% from June 2018 ($273,800), according to the National Association of Realtors.
The seven cities with home prices seeing bigger annual gains included San Diego; Washington, D.C.; Detroit; Minneapolis;
Charlotte; and Cleveland.
Las Vegas, Phoenix and Tampa reported the highest year-over-year gains among the 20 cities in the Case Shiller Index. In May, Las Vegas saw a 6.4% annual price increase, followed by Phoenix with a 5.7% increase, and Tampa with a 5.1% increase. Seven of the 20 cities reported greater price increases in the year ending May 2019 versus the year ending April 2019.
“Though home price gains seem generally sustainable for the time being, there are significant variations between YOY rates of change in individual cities,” noted Murphy in the release. “Seattle’s home price index is now 1.2% lower than it was in May 2018, the first negative [year-over-year] change recorded in a major city in a number of years. On the other hand, Las Vegas and Phoenix, while cooler than they were during 2018, remain quite strong.”
The report shows substantial diversity in local price trends. Given that seven cities experienced stronger annual price gains in May than they did in April, if the inventory of homes for sale shrinks further, more cities could see that same turnaround in prices.

