
Stocks are quickly closing in on an important level that some traders believe could make or break the market’s post-Christmas bullish run.
The S&P 500 is poised to take aim at an extremely important level in the coming week. The 2,600 level has sucked in all sorts of market watchers — technicians and non-technicians alike — who are waiting to see if the S&P can cross above that threshold and move higher, a sign to some that stocks may have found a bottom during Christmas week.
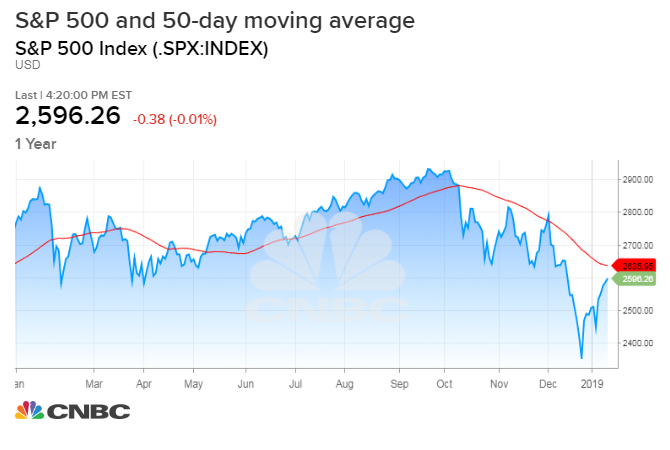
The S&P 500 was just shy of that level, ending Friday at 2,596.26 after touching a high of 2,597 Thursday.
If the S&P fails to crack 2,600, it could be a level that the market will continue to revisit, but it could also signal a retreat to test the recent lows.
“About three or four days ago when the market started to get back to 2,600, volume started to shrink and nobody believes this rally. If I think about this from the most positive or bullish standpoint, I think you can have a quiet pause near 2,600. In terms of technical patterns, it almost seems like a bullish flag,” said Instinet’s Frank Cappelleri .
Cappelleri points out that the violent swings of recent weeks subsided as the S&P approached 2,600. He said the S&P went for a fifth day Friday without a one percent move higher or lower fir the first time since October. That’s the longest quiet period since the index went 74 days without a one percent move between June 26 and October 9.
But 2,600 could also be a red flag. “It could reverse pretty violently, and I think that’s what a lot of people expect because we are in proximity of the level everyone’s been talking about— 2,600. The most surprising move could be that the last few days developed into a potential bullish flag, and you have another move before there’s a decline,” he said.
The S&P is taking aim at 2,600 after it has quickly regained more than 10 percent from its Dec. 24 closing low. Analysts said the earnings season, which starts in the coming week with major banks, could be an important catalyst for the S&P in either direction.
“This is pure chart-based thing. There’s not any fundamental magic involved in it,” said Julian Emanuel, BTIG chief equity and derivatives strategist. Emanuel described the level as a “wall of resistance.” He said it would make sense for the S&P 500 to pull back from this level before attempting to hold above it again.
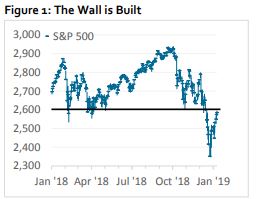
Source: BTIG
“If you look at the last year in particular, it was where the first leg of the sell off troughed in October,” said Emanuel. “It’s where the pullbacks bottomed before the summer rally. Very simply, people look at those kind of things in an environment where you’re struggling to explain the price action both to the downside and now to the upside.”
The 2,600 is actually the beginning of a whole band of important levels, according to Robert Sluymer, technical analyst with Fundstrat. The Oct. 29 low was 2,603, and the 50 percent retracement of the decline from the highs in October is 2,643.
The 50-day moving average is also at 2,635.
“If you’ve been bearish, this just looks like a bear market rally and people are going to start shorting. This is where the bulls and bears come together, and you’re going to start to see this tussle,” said Sluymer.
Sluymer said he believes the market put in a cycle low. It closed at 2,351 on Christmas Eve .
“It’s still to be proven. There’s lots of damage to the market and the market is going to take time. Ultimately, I think you’ll get a pullback,” he said. “If you’re a short term trader, this is not where you want to put capital to work. If you’re bearish, this is where you start putting on shorts.”