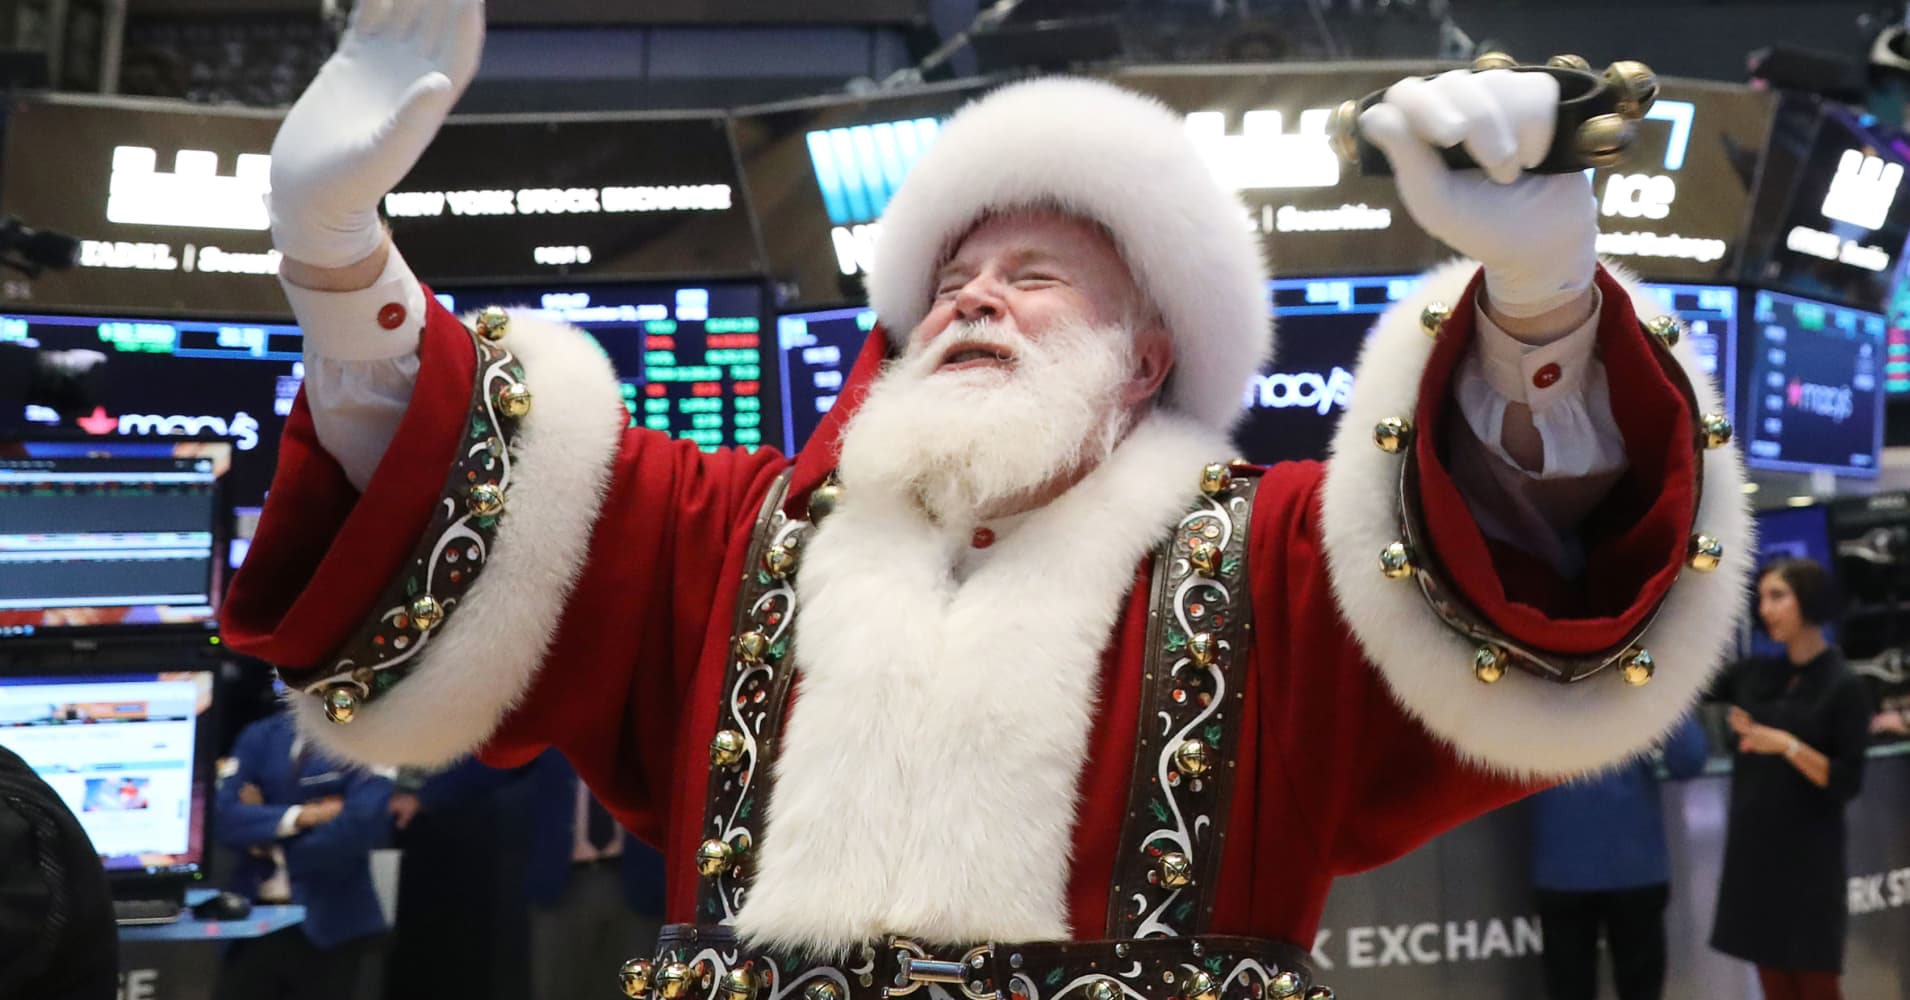
A Santa Claus rally, which would begin on Monday, is a very specific event: the tendency for the market to rise in the last five trading days of the year and the first two of the new year, good for an average gain of 1.3% in the S&P since 1950, according to the Stock Trader’s Almanac.
Ari Wald at Oppenheimer has studied this event over an even longer period: Since 1928, the S&P 500 has averaged a 1.7% gain and traded higher 78% (70 out of 90 years) of the time through this seven-day period.
That is notably higher than the average gain during any seven-day period during that time, which was up 0.2% and trading higher 56% of the time.
Why this works is not entirely clear. The usual explanation is that the first half of December is dominated by tax-loss selling, and once that is completed, buyers usually step in and buy beaten-up stocks, and since volumes are typically light in the second half of December a modest increase in buying interest will produce a rally.
But the Santa Claus rally is usually framed in the negative: “If Santa Claus should fail to call, bears may come to Broad and Wall.”
Negative returns were associated with down years in 2000, 2007 and 2015, though it did not work for 2004 and 2016.
But the overall trend is still fairly compelling.
“The S&P 500 has averaged a 1.2% loss in the subsequent three months following [negative returns] versus an average 2.8% gain following a positive Santa Claus rally,” Wald told me.
Is there any hope for a Santa Claus rally this year? What are the chances the markets could reverse the worst December since 1931?
So far, it’s been pretty pathetic. There has been a lot of money thrown at the market, and look what happened Friday: The market ignored the positives and fixated on the negatives.
New York Fed President John Williams told CNBC’s Steve Liesman on Friday morning that the Fed was not necessarily committed to hiking rates further.
This was a market-friendly comment. That produced a 20-point rally in the S&P 500 that lasted all of two hours.
Then late in the day, Peter Navarro, an assistant to the president as director of trade and industrial policy, said it would be “difficult” for the U.S. and China to arrive at an agreement after the 90-day period of talks unless Beijing is prepared for a full overhaul of its trade and industrial practices.
The S&P 500, already down 30 points, immediately sank another 30 points and closed just off the lows for the day.
Here’s the key question: What is the right price at which buyers will emerge?
For Alec Young, managing director, global markets research at FTSE Russell, that price is roughly 2,350. In his mind, the market is pricing in flat earnings for 2019, and with a modest slowdown the right multiple for the S&P would be between 14 and 15. That would produce a price of about 2,350.
“This is setting up for a very good first quarter,” Young told me. “We are pricing in a lot of bad news. The market has priced out all of the earnings growth for next year.”
At this rate, we could hit that target early next week — it’s only 60 points away. Still time for a Santa Claus rally!

