
AK2/E+ via Getty Images
To start the conversation, silver is traditionally a top long-term hedge against inflation and currency debasement, exactly the environment we find ourselves in 2022. Hence, silver’s drift lower since August 2020 is something of a headscratcher. Industrial metals like copper, iron, zinc, aluminum and nickel have spiked higher, cousins to silver. Lumber and oil/gas had terrific runs with the record central bank money printing exercise to combat COVID-19. Crazy gains were seen in cryptocurrencies and the stock market into late 2021. Hard assets with an income stream like real estate reached for tremendous gains over a few years.
However, the monetary metals of silver and gold barely budged in relation to record Treasury debt issuance and basic money supply growth in America. Historically speaking, the last 15 years have ranked as one of the weakest periods over the last 100 years to own silver, when compared to the rapid growth in Treasury debt issuance (requiring future money printing) or M2 money supply increases. Below is a graph of the lagging silver response.
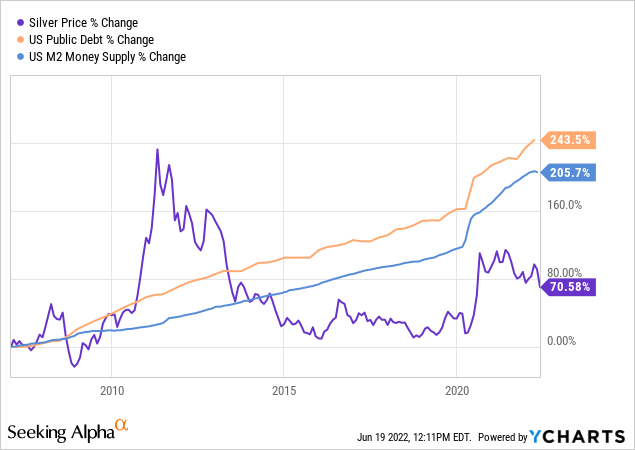
YCharts
On a variety of scales and comparisons, silver looks like a better long-term value vs. other related metals. Copper is the closest relative to silver on the industrial-side of the equation. Both copper and silver are heavily used in electronics, as great conductors of electricity. While copper’s main utility is through wires to transfer electric power over distance and in motors, silver has become quite critical in solar panels and semiconductors. Although their use as money in coins has diminished over the years since the world moved away from monetary metals to back paper currency in the early 1970s, silver remains a major jewelry choice. And, if we ever revert back to a gold/silver standard for money, huge demand by central banks and governments could return one day. Anyway, silver has risen less than either copper or gold prices since the last important bottom in these critical metals around 2001, better than 20 years ago. As such, this lower relative price/valuation may offer extra upside in a multi-year bull market.
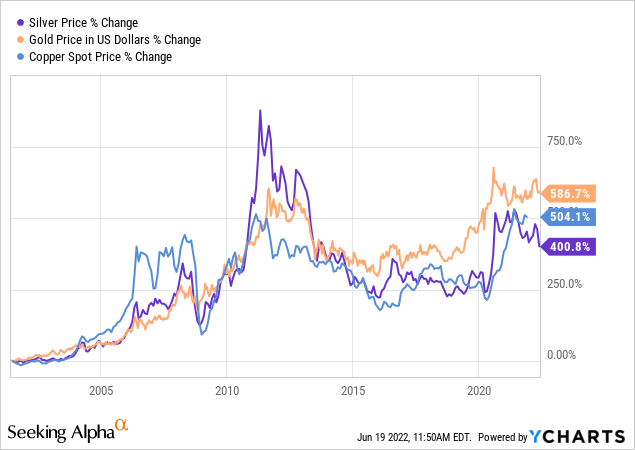
YCharts
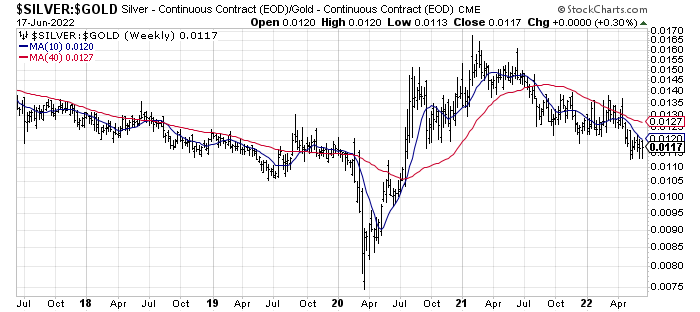
Below are comparison graphs of silver vs. copper and gold over the last five years. Notice that the intermediate-term “valuation” setup seems to also argue silver has stronger upside potential.
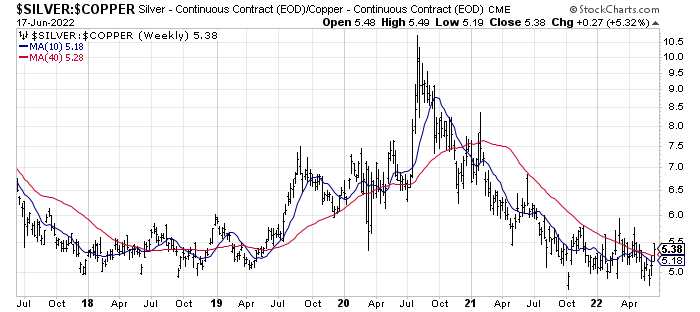
StockCharts.com
StockCharts.com
If you do not follow precious metals closely, you may not be aware gold and silver buried in your back yard have beaten long-term stock returns since the year 2000. That’s right – Wall Street experts, the WSJ and CNBC do not regularly announce U.S. equities have “underperformed” simple metals gains for decades, measured from the original technology dot.com bubble peak.
Even fabled investor Warren Buffett is not happy gold has bested his total return outlined by Berkshire Hathaway (BRK.B) (BRK.A) since 1998. The truth is gold’s performance has far outpaced “official” government inflation stats and gained dramatically faster than short-term savings rates averaging 4%, with a decent +8% annualized compounded gain achieved since the late 1960s (accurately hedging similar percentage gains in Treasury debt outstanding and the M2 money supply).
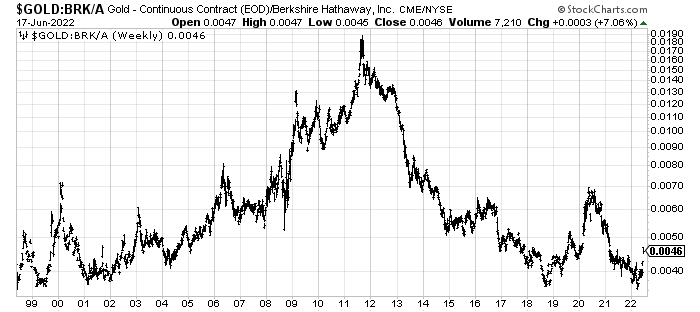
StockCharts.com
Silver’s minor gain since 2019 has actually outperformed the Dow Jones Industrial Average total return for years. Measured from either September 2018 or even the Tech Boom peak of mid-2000, silver is surviving better than you will hear in the popular financial press.
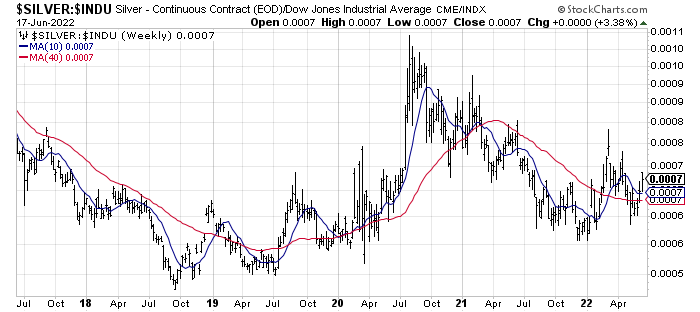
StockCharts.com
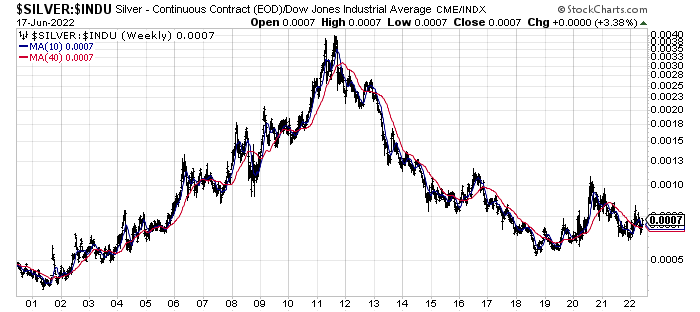
StockCharts.com
Positive Sentiment Setup
Futures traders and speculators are the most bearish on silver since the important 2019 bottom. In addition, commercial hedgers are the most bullish in three years. If you had purchased silver the last instance few were expecting a big rally, a near DOUBLE in price over 15 months was your reward between June 2019 (marked with the green arrow below) and September 2020. From my 35+ years of trading experience, the best time to buy a commodity is after a multi-year decline, when investors are not interested or excited about its future. [Conversely, the worst time is when everyone is talking about investing in a commodity, like oil/gas ETFs and related E&P industry picks today.] So, I rate the sentiment backdrop for silver as incredibly positive right now.
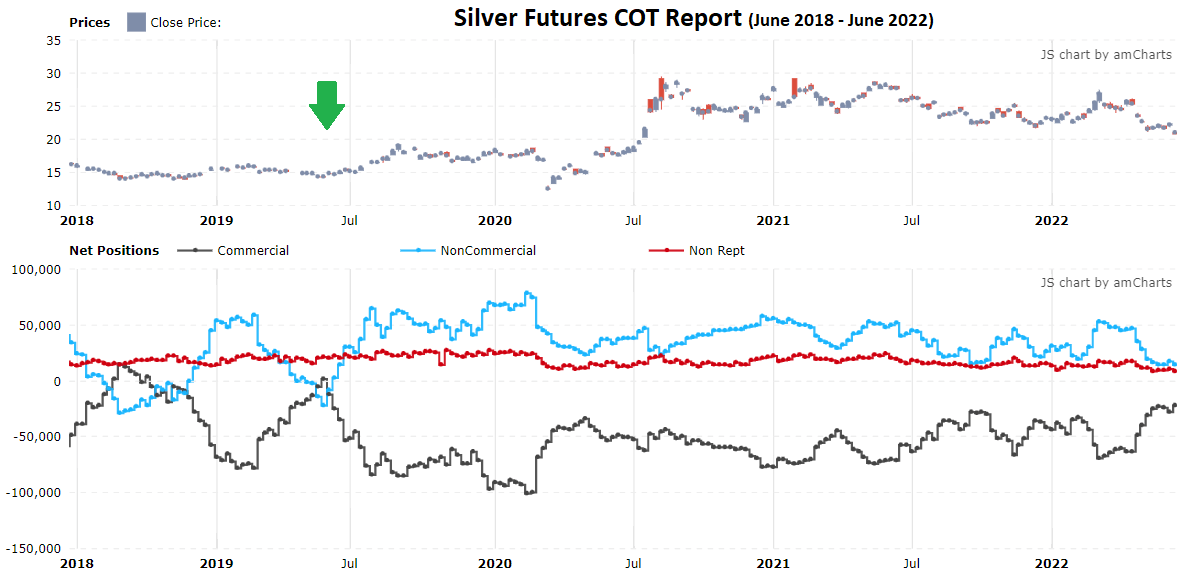
4-Year Chart, Silver Price vs. COT Report – Tradingster Website
History of Price Spikes Every 2-3 Years
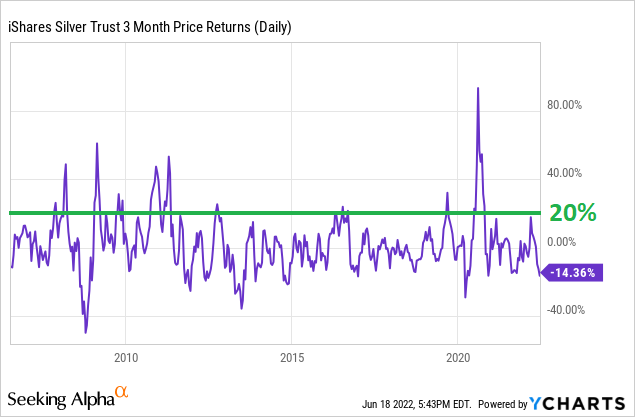
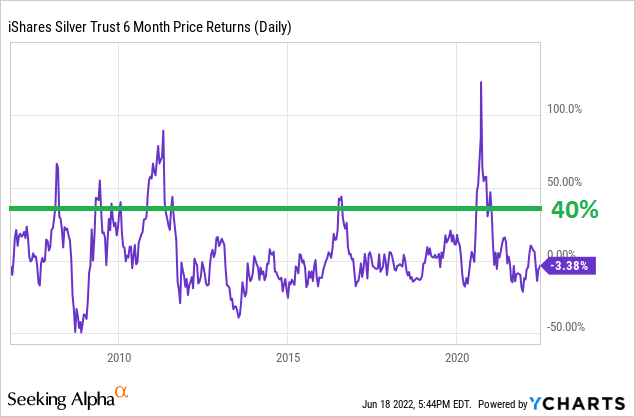
Another bullish idea to contemplate is the lack of silver gains since September 2020 will not last forever. From a statistical review, the odds favor a price gain of better than 20% once every two years, and a 40% advance once every three years, all other variables being equal. On the 15-year graphs below, I have drawn rolling 3-month and 6-month returns for SLV. I count at least 8 instances of large/swift 20%+ jumps in price since 2007. In addition, gains of 40%+ have been recorded at least 5 times. Historically, this frequency record is quite consistent over decades of trading in silver. It’s been nearly two years since either level of price rise has been achieved. So, one could argue a solid quote advance is due to begin soon (with a 3-month or 6-month lag from now to appear on the related charts).
YCharts
YCharts
iShares Silver ETF
I personally use the largest silver-backed bullion ETF to trade and hedge my portfolio. For liquidity and safety reasons, I prefer the iShares Silver ETF (NYSEARCA:SLV) with $12 billion in AUM. But there are a number of similar products investors can use including Aberdeen Standard Physical Silver (SIVR), Sprott Physical Silver (PSLV), Invesco DB Silver (DBS), and the 2x leveraged product ProShares Ultra Silver (AGQ).
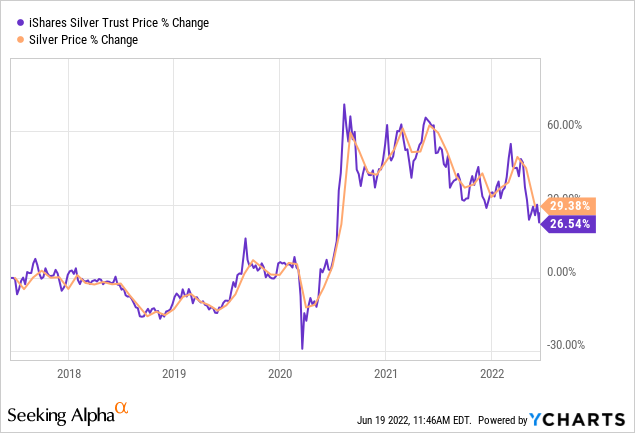
The 0.5% annual expense/management fee for SLV is average for the sector, and a necessary cost to avoid taking actual possession of silver bars. The upside of investing in SLV is the security and vaulting of silver is handled by the trust, with online trading commissions of zero or next to nothing per trust unit. Below are 5-year and 15-year graphs of the “holding cost” owning iShares Silver vs. the spot silver bullion price over longer periods of time. If you want to own actual physical silver over many decades, and are able to buy near the spot New York or London price (which is difficult today as a silver bullion/coin shortage has existed since COVID-19 hit), sidestepping ETF ownership in your brokerage account is a reasonable conclusion. I personally hold some physical coins as a rainy day, emergency fund.
YCharts
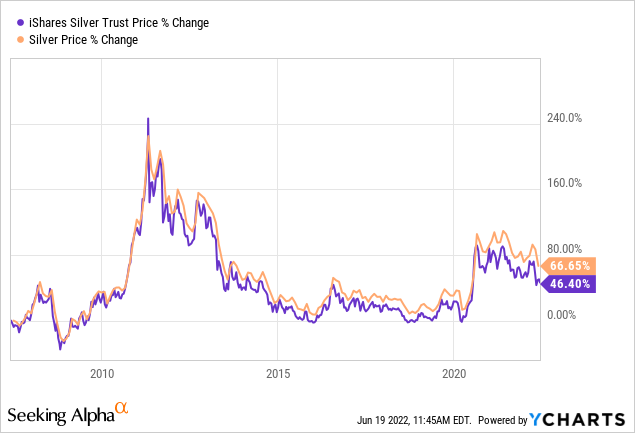
YCharts
For SLV specifically, the majority of momentum indicators I track actually bottomed back in September. For example, on the chart below I have circled in green the low points for the Accumulation/Distribution Line, Negative Volume Index, and On Balance Volume. My read of the technical picture is the May/June decline to new 52-week lows is not being “confirmed” by increasing sell pressure, just the opposite.
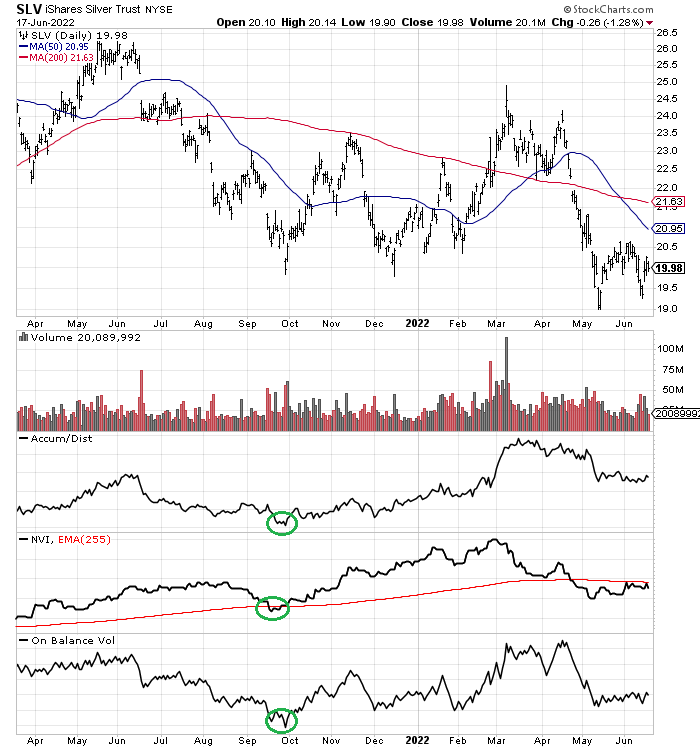
15-Month Chart, Daily Values with Author Reference Points – StockCharts.com
Final Thoughts
Silver appears to be quite undervalued in relation to other metals, and should be galloping higher in reaction to the inflation and money printing addiction America is facing currently. Sentiment is positioned for a major bottom in silver, and some sort of strong price advance is becoming overdue.
What are the risks owning silver and the iShares Silver ETF? The biggest risk getting much playtime on television and the internet is an economic recession will hurt demand for industrial metals. Sure, I totally agree this is a risk. Akin to the early pandemic shutdown-induced dump in silver, a short-term bearish move is possible. But, such a scenario would open an even smarter buy opportunity in my opinion, encouraging a rubber-band like snapback reversal in 2023.
If you do not hold a silver position today, one way to reduce the upfront risk of starting a stake would be to break up your purchases over time. A cost-average approach over 3-4 months could mitigate oversized losses, assuming another $3 or $5 of silver downside hits in a deep recession. If we get a steep slide in economic output the rest of 2022, there is little doubt the Federal Reserve would respond with huge stimulus again. Connecting the dots in this scenario, flight-to-safety demand by investors, money printing hedging by banks/institutions/hedge funds, on top of a sharp rebound in industrial demand next year could pump silver above $30 an ounce from $21.60 today.
What’s the upside potential? That’s a great question. A move to $30 or $40 an ounce for silver (about the same price for the SLV product) may be in our future, just to catch up to the relative price level of copper and gold. When you review long-term charts over many decades, a gold/silver ratio of 40x is considered normal. If we get US$2500+ gold next year (which is my current forecast), projecting $50 to $60 silver in several years may prove right on target. This hypothetical upside of 150% to 200% would likely be a top-tier commodity advance.
Given worst-case downside of -25% vs. best-case upside of +200% over the next 18-24 months, why not dig deeper into the silver investment proposition? It may provide level-headed investors with a unique risk-reward setup, not easily found in other parts of the June 2022 investment landscape.
Thanks for reading. Please consider this article a first step in your due diligence process. Consulting with a registered and experienced investment advisor is recommended before making any trade.