

At the Tokyo 2020 Olympics, each day records are being set by the dozen. Globally, a different set of records are making history but for the wrong reasons.
The number of so-called “planetary vital signs” hitting new highs and lows, despite the restraint to human activity from the pandemic in the past year, were highlighted in a paper published earlier this week that tracked a set of various indicators related to climate change.
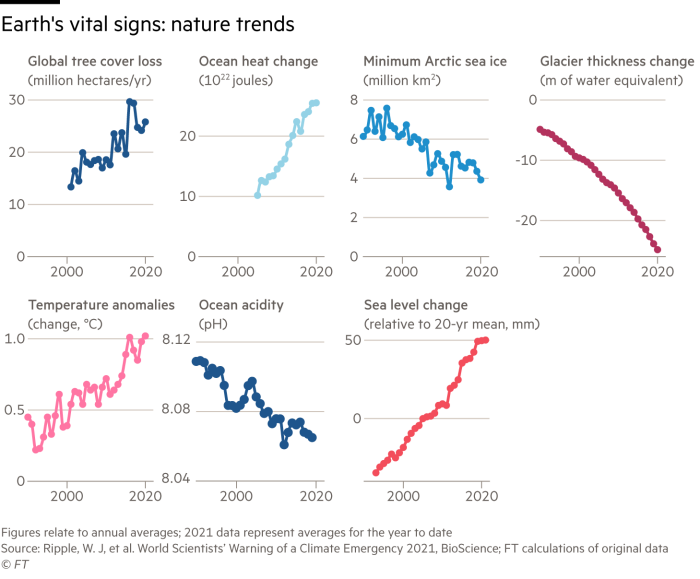
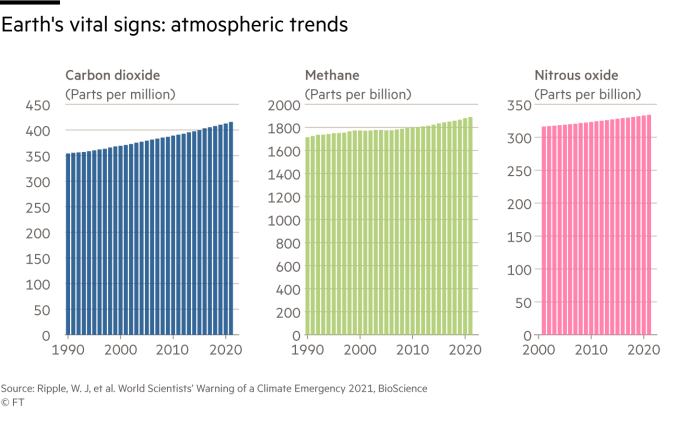
Glaciers have been melting at record pace; sea levels are at an all-time high, and concentrations of carbon dioxide, methane and nitrous oxide in the Earth’s atmosphere have never been so dense, the data show.
“I’m concerned. I’m alarmed. I feel like it’s important for people to see these data together,” said William J. Ripple, a professor of ecology at Oregon State University and co-author. “My conclusion is that we are mostly doing business as usual, with the transient interruption of the Covid-19 pandemic . . . but we’re [already] getting back to setting new record highs.”
The paper’s release comes as the scale and frequency of recent weather events leads some scientists to conclude that global warming is to blame.
Among the indicators are the anomalies for land and sea surface temperatures, which reached record highs in certain areas in 2020.
At the same time as oceans warmed to peak temperatures, according to the tracking data, their acidity was at the highest level recorded in seven years. Combined, these effects are known to bleach warm-water coral reefs. And there are fears the trend in these conditions could soon reach a “tipping point” — beyond which, the destruction caused would be difficult to reverse.
One of scientists’ key concerns, highlighted in the paper, was the lack of lasting impact the Covid-19 pandemic had accumulated on the “vital” indicators.
“Huge behavioural changes by humans in reducing energy consumption [as a result of the pandemic] had such a small effect,” Ripple explained. “We need to be thinking about big transformative change at this stage . . . yet, we are still in a fossil fuel society.”
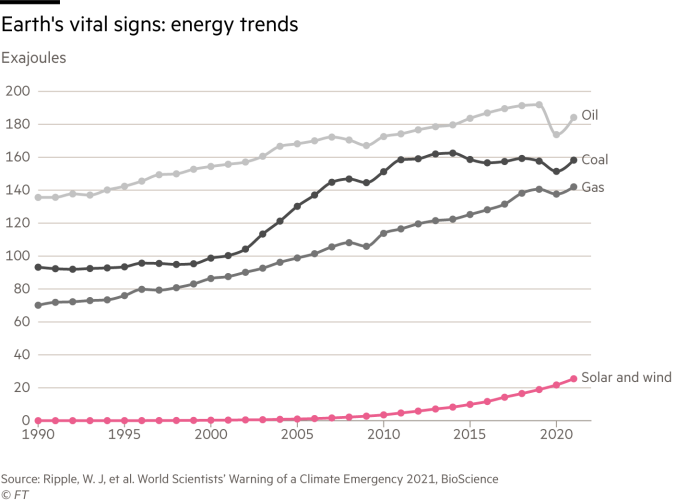
Energy consumption from fossil fuel sources fell as the pandemic brought industry and services near to a standstill in 2020. Yet global energy use originating from coal power is expected to reach above pre-pandemic levels this year, the forecasts suggests, while energy consumption from oil and natural gas sources will rebound.
As many as 18 of the 31 indicators being tracked by the group of scientists have reached recent extremes.
Yet not all can be viewed negatively — some provide a glimmer of hope.
Wind and solar energy use is expected to be up by a third this year, from 2019 levels, for example.
The value of global subsidies on fossil fuels dropped by more than 40 per cent in 2020, compared with the previous year.
And, divestments of fossil fuel assets by pension funds, educational institutions, governments and other organisations continued to rise — up to $14tn in 2020 from $11.5tn the previous year.
But, the authors conclude, the scale of climate action presently is not enough to reverse key trends of concern.
“We’re in a climate emergency . . . a very dangerous climate emergency,” Ripple says. “At this point it’s important that we do things that will have rapid effects.”