
There’s a number of tools, charts, and models traders use to help them forecast bitcoin price cycles and our last article discussed leveraging the Golden Ratio Multiplier. The following editorial discusses another method of bitcoin price prediction analysis by utilizing Logarithmic Growth Curves. In September 2019, a comprehensive paper published by Harold Christopher Burger describes how crypto proponents can visualize bitcoin price cycles using the Power-Law Corridor model.
Bitcoin’s Logarithmic Growth Curve
In order to give our readers some deeper perspective, Bitcoin.com News has been covering a few useful price models that technical analysts and crypto traders leverage to forecast bitcoin’s future prices.
The previous report discussed the Golden Ratio Multiplier and how bitcoiners can use the well known golden ratio and the Fibonacci sequence to predict future values. The next subject takes a look at how crypto enthusiasts can use Logarithmic Growth Curves to get some perspective on bitcoin (BTC) price cycles.

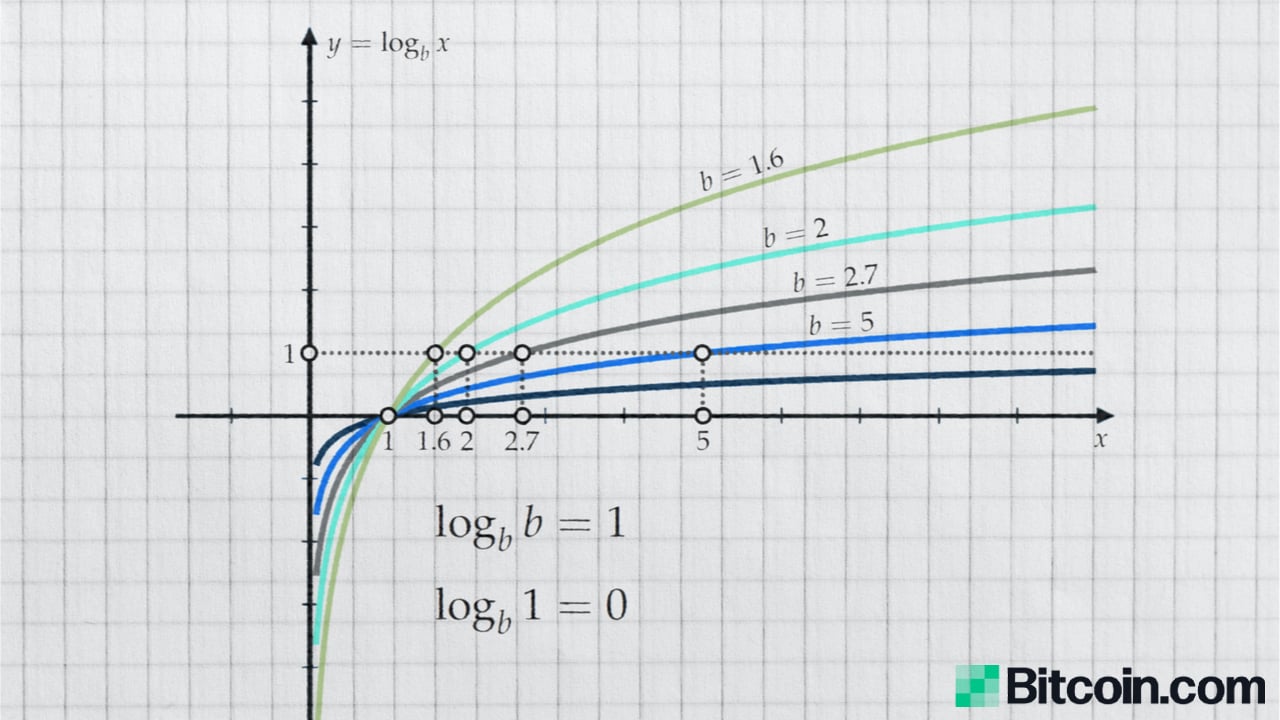
Essentially, logarithmic growth is the inverse of exponential swelling and it is much slower than rapid and aggressive growth. Logarithmic growth is leveraged in biology and various sciences but exponential and logarithmic functions can be used in finance as well.
Bitcoin’s price timeline can be seen from a logarithmic perspective. In fact, a log price chart is one of the most popular in the world of crypto and traditional finance technical analysis. In simple terms, a crypto asset’s log chart leverages conventional percentage rates and all spacing is equivalent to scale.
Even the most basic of logarithmic BTC charts, the individual can get an entirely different look than the typical crypto price charts using candlesticks and different time frames. Additionally, bitcoin traders can look at the crypto asset’s Logarithmic Growth Curves model which gives even more perspective.

This particular Logarithmic Growth Curve (LGC) price model hosted on lookintobitcoin.com (chart shown above) was created by Cole Garner and @quantadelic. Further, the price model was also “inspired by the work of Harold Christopher Burger,” the website notes.
Harold Christopher Burger published a comprehensive study on LGC in his paper called “Bitcoin’s natural long-term power-law corridor of growth.” When Burger wrote the paper in 2019, he mentioned a number of individuals like John McAfee ($1M), and Nouriel Roubini ($0) forecasting outlandish price predictions.
In his editorial, Burger looks at bitcoin’s (BTC) full price history from a logarithmic point of view. Essentially, Burger describes BTC’s possible future price patterns with the power-law or Power Law Corridor (PLC) model.
Burger said at the time, he is “quite confident in the long-term, the price will indeed evolve approximately as stated” in his article. His study notes that bitcoin follows a price corridor that can be divided into two bands.
“One which lies at the lower-end of the price predictions and is rather thin, the other one being much larger and lying at the higher-end predictions,” the analyst’s paper details. “Bitcoin’s price spends about equal amounts of time in both bands. This implies that large bubbles and busts are likely to continue to exist.”
The researcher that blogs for Quantodian Publications explains that the price model helps people determine the market’s entry and exit points. “This model allows us to make broad predictions concerning the long-term future price of bitcoin,” the blog post emphasizes referring to two forecasts.
- “The price will reach $100 000 per bitcoin no earlier than 2021 and no later than 2028. After 2028, the price will never drop below $100 000.”
- “The price will reach $1 000 000 per bitcoin no earlier than 2028 and no later than 2037. After 2037, the price will never drop below $1 000 00.”
Constant Movement: Normal and Bull Mode
After doing some math, equations, and linear regression, Burger found that a basic level of support for BTC’s price followed a power-law. He performed the linear regression with bitcoin’s price peaks in 2011, 2013, and 2017.
“The market tops also seem to follow a power-law,” Burger said. “If the next market top also follows this power-law, the market top will lie on this line. The slope of this power-law is 5.02927337, whereas the fit on all data gave us a somewhat larger slope of 5.84509376. This indicates a relative taming of bitcoin bull markets compared to the overall trend-line,” the author added.

When Burger quantified these measurements defined by the three bitcoin market price highs and coefficient of determination, the researcher came up with two power-laws. He also leveraged random sample consensus, or RANSAC to get more data points.
The researcher then found two modes, one normal and one bull, and was further able to formulate different power-law models for BTC’s price. Burger shows a chart that includes “power-law fit,” “power-law fit minus bias,” “power-law fit on only three tops,” and “robust fit.”
“We now have various models to predict the future price of bitcoin. All we have to do is extend the graph,” Burger blog post notes. The researcher adds:
We can further divide this corridor into two bands, one corresponding to the “normal” mode and one corresponding to the ‘bull’ mode. The price has so far spent half the time in the lower ‘normal mode’ band, and the rest of the time in the higher ‘bull mode’ band.
‘Black Thursday’ and the Current State of Affairs
The power-law corridor of growth blog post written by Burger has followed bitcoin’s price movements pretty well since it was published. The Quantodian Publications author does note, however, when he was modeling a support line for bitcoin’s price to follow a power-law that there was one instance in 2010, where the price of BTC breached below the line.
Since the blog post was published on September 4, 2019, there is a second instance where bitcoin’s price breached the “robust fit” line.
This specific time was during the financial meltdown on March 12, 2020, otherwise known as ‘Black Thursday,’ when BTC and nearly every asset in the world saw values sink. March 12 was considered a freak instance and possibly an outlier because of the fear and shock Covid-19 brought to financial markets.
Lastly, the current chart shows bitcoin went through a bullish cycle in recent times, but hasn’t peaked like the rest of the bull cycles. In fact, the chart shows the northbound price climax plateaued much lower than the other peaks and the price has started to head southbound.
What do you think about log charts, power-law, and utilizing Logarithmic Growth Curves to predict bitcoin price cycles? Let us know what you think about this subject in the comments section below.
Image Credits: Shutterstock, Pixabay, Wiki Commons
Disclaimer: This article is for informational purposes only. It is not a direct offer or solicitation of an offer to buy or sell, or a recommendation or endorsement of any products, services, or companies. Bitcoin.com does not provide investment, tax, legal, or accounting advice. Neither the company nor the author is responsible, directly or indirectly, for any damage or loss caused or alleged to be caused by or in connection with the use of or reliance on any content, goods or services mentioned in this article.
Read disclaimer